I note down interesting points from DIN-Handbook 523 as follows:
DIN IEC 98 (October 1989): Analoge Schallplatten und -Abspielgeräte; Identisch mit IEC98:1987(Analogue audio disk records and reproducing equipment: same as IEC 98:1987)
I was in doubt about my rapid reading of IEC60098 (original in French/English) and perused this German translation. I make following notes about the inner/outer groove radius.
- From clause 8.5: The outer recorded groove radius shall be less than 146.3mm.
- From clause 8.8/8.9: The inmost recorded groove radius for 30cm LP can be interpreted in various ways. No specific value, but I assume more than 59.6mm as intermediate value between 56-63.2mm where finishing groove radius (53.2mm±0.4mm) + one turn of lead-out groove pitch (6.4mm±3.2mm) = inmost recorded groove radius. Then minimum 57.5mm in DIN is covered by extreme minimum 56mm in this IEC because DIN/IEC adopted same specifications about finishing groove radius and lead out pitch.
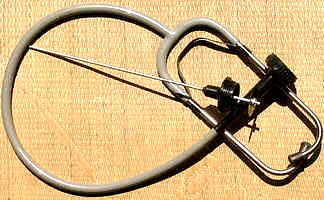
I find an interesting article about distance from the centre of mounting holes of cartridge to stylus tip. Fig.2 in connection to clause 11.5 shows 9.5mm±1mm at recommended tracking force. This clause 11.5 recommends: mounting screw M2.5 (or M2.6 where M2.5 is not available) and cartridge weight (mass) not exceeding 12g. Tip distance 9.5mm is derived from 3/8 inch as often Shure cartridges have such value. In JIS C5503(1979) Phonograph pick-ups, tip distance is indicated as 10mm±3mm (wide enough for almost all cartridges to fall in this range) showing simple drawing (total length max. 60mm from pin to head and max. 18mm from center of mounting holes to head). It is only a matter of conventional practice and depends on the products available or most popular at the time. The strange recess min. 5mm in Fig.2 may be designed according to then current SME type of headshell having the rim bent for reinforcement.
Clause
8.1 Direction of groove modulation: suitable vertical tracking angle (VTA) is
20degree +5/-0. The resulting modulation shall be optimum for
reproducing styli having a rake angle (SRA) of between 0 and -5degrees.
I think effective vertical modulation angle (VMA) recorded in
vinyl should match vertical tracking angle (VTA) for cartridge. Recommended VTA (and VMA) in
60's
was about 15degrees and then in 70's it became 20degree +/-5 and from early 80's
it
became 20degree +5/-0. VMA is not equal to cutter head angle on lacquer. The cutter head should be more inclined than effective modulation angle due to
the elasticity of lacquer. IEC98-1964 & BS1928-1965 have a following NOTE:
"In practice, angles of between 0degree and 25degrees may be
encountered" . VTA of
cartridges in early '60 was ranging between 8degrees (Neumann DST1212) and
36degrees(Shure M77) -see VTA of old cartridges.
In
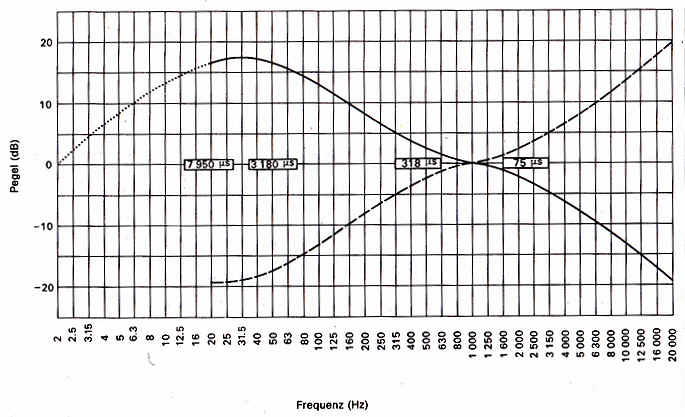
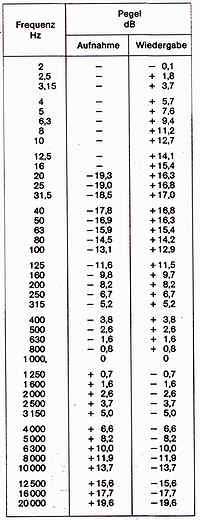
comparison with RIAA(3180/318/75μs, 50/500/2120Hz), this IEC (clause
10.2.1) suggests an additional time constant 7950μs/20Hz in order to
suppress subsonic noise. It results in 3dB difference at 20Hz between recording and
reproduction as under. Clause 10.2.2 Tolerance for reproduction chain: a) 2-20Hz
reproducing curve should be on or under the dotted line b)20Hz-20kHz no
tolerance is stipulated. In practice some preamplifiers are equipped with
subsonic filter 12dB/Oct under 15Hz for the same effect since IEC time constant
(and its curve 6dB/Oct) is an example. IMO: Historically speaking the bass
limit for phono amplifier is changing by time. Before 1950 low limit was often
not stipulated since there was natural bass limit in
microphone/amplifier/speaker. Later in Hi-Fi era after developing LP, the
handling frequency for microphone/amplifier/speaker has been much extended and
there arises a need for suppressing rumble noise (and low frequency resonance
between arm mass and cartridge compliance which has became lower than 20Hz).
"Nominal" low limit: year 1948 Columbia LP 100Hz>1954 RIAA
50Hz>1987 IEC additional 20Hz. If you are interested in equalizations,
please look into my equalizations.xls in spread
sheets (1987 IEC revision is shown in EXAM sheet).
NAB(1964) specified reproducing characteristic
between 30Hz-15000Hz and recommended that "the system response below 30 cps and
above 15,000 cps be attenuated at least 6 db per octave with the 3 db points at
20 cps and 16 kc." Cut under 20Hz is to avoid intermodulation,
cut from 16kHz is to supress harmonic distortions by tracing on
record. I appreciate NAB's foresight.
1)
The conventional "hearing range 20Hz-20000Hz" is often misunderstood.
Hearing field represents normal characteristic
as is. Range of audible frequencies in music is
narrowed for usual and lower sound levels. This fact is the reason why we can
enjoy old recordings (musical balance) in every format. The difference
among various formats can
be attributed to dynamic range (Shellac 30-50dB, Vinyl 66dB
and CD 85dB) and genre of music corresponding to the required sound levels:
(roughly) Vocal +/-20dB and Symphonic +/-35dB from central sound level 60dB-65dB. One would like to pay attention to peaks or limits and ignore average:
mixing up theoretical/nominal/potential values (big numbers)
with
practical/real values. Music or
art is not point game. There is no license nor superior hearing ability
required to enjoy music.
2) Meanwhile hearing data were
usually collected from some healthy adults: 18-25 years old in case of
ISO 226 Acoustics - Normal equal-loudness-level contours (2023). Older
adults are not counted as "normal" from the viewpoint of otology. It will express
softly "informative" instead of "normative" data in accordance with recent
compliance.
3) Most audiophiles would not check their ears with frequency
record: often resulting in discouragement (one's pride is shattered). Some
measurements of audio gear
are found welcome, but the measurement of own ears is unwelcome.
IEC 60098(IEC98-1987) is modifying or replacing DIN 45538(definitions of disk record reproducing equipment), 45539(guidelines for measuring method, specifications, connection, exchangeable pickup system, requirement on reproducing amplifier etc), 45546(StereoRecord 45rpm), 45547(StereoRecord 33rpm) and 45548(criteria for record reproducing equipment). The following are extracts mainly from DIN standards.
DIN 45500 T3 (1975):Heimstudio-Technik (Hi-Fi); Minderstanforderungen an Schallplatten-Abspielgeräte (Hi-Fi technics; requirements for disk record reproducing requirements)
This
standard is almost similar to IEC 60581-3(1978) defining minimum performance requirements.
Both standards mentioning: allowable deviation from rated speed +1.5%-1%/wow and
flutter ±0.2% maximum/Rumble ratio more than 35dB unweighted and 55dB weighted
(in addition to rumble IEC specified reference signal-to-hum ratio more than
50dB at reference velocity 3.83cm/s rms and reference frequency 315Hz)/static
VTF maximum 0.03N/channel unbalance less than 2dB at 1kHz/channel separation
over 15dB between 500Hz (315Hz in IEC) and 6300Hz: over 20dB at 1kHz/VTA
20±5degrees. This standard comments on compliance (static measured) for
every direction to be minimum 0.8cm/N (8x10^[-6]cm/dyne) corresponding to the
maximum braking force (resilience=Rückstellkraft) 7.5mN(0.75p) measured
at displacement 60μm. The compliance for lateral direction shall be bigger
than that for vertical direction. Further mentioning: rated output voltage of
velocity sensitive pick-ups (for example magnetic cartridges) to be 5 to 15mV at
1kHz with load 47kΩ for peak velocity 10cm/s (channel sensitivity 0.7 to
2mV/cm/s as per IEC). In case of displacement=amplitude sensitive pick-ups
such as piezoelectric cartridges: 0.5 to 1.5V with load 470kΩ for peak
velocity 10cm/s. FIM (frequency intermodulation) distortion at tracing -6dB
reference tone shall be lower than 1%. Standard spherical stylus tip radius
15+3-0μm and standard bi-radial tip radius 6μm and 18μm.
This IEC specified
separation of R from L and L from R respectively and made note: Separation and
crosstalk are equivalent only if there is no unbalance output between R/L.
In
IEC98-1987: Separation precedes crosstalk because separation is independent of
channel sensitivity. Hence playing back test record with R or L signal
alternatively, the separation of channel L from channel R: 20log(L output
voltage from L channel signal divided by L leakage voltage from R channel
signal), the separation of channel R channel from channel L: 20log(R
output voltage from R channel signal divided by R leakage voltage from L channel
signal). And indicate smaller value of measured channel separations at 1kHz.
Allowable deviation from rated speed
+1.5%-1% is too large. Provided the speed deviation +/-0.2% is allowed, the drift of
strobe-patterns shall be as following table. To get exact 45rpm at
50Hz, patterns should be drifting -15/minute. See also my
EXCEL file for rpm & strobe pattern designs. IEC98-1987: Besides using
conventional strobe disc (method A), 120 revolutions of a record are timed by
means of a stop watch (method B) for T 160seconds for 45rpm or T
216 seconds for 33 1/3rpm defining the mean deviation as (T-t)/t x
100% where t shall mean the measured time passed during 120
revolutions. Measuring method B is accurate because it is independent of the
power supply frequency deviations for strobe light. Hence in some turntables
equipped with quartz-locked signal generators, the generated signals are used
for motor control and strobe light.
My note about
the sensitivity
of cartridge: The velocity of groove modulation is usually expressed as peak
cm/s while output voltage is conventionally shown as mVrms in accordance with
the indication of millivoltmeter. Relative output in this DIN (5 to 15mVrms
for peak velocity 10cm/s) is equivalent to sensitivity in IEC
expression (sensitivity 0.7 to 2mV/cm/s where output mV and velocity
cm/s are both either effective [rms] or peak values). DIN45500
&45539 about cartridge output were often misused and outputs were expressed
incorrectly as "mV/cm/s or mVs/cm" while original DIN indicated
relative output in mVrms for peak recorded velocity. IEC 60581-3 was based
on DIN, but maybe IEC people became aware of such misuse as simple division of
rms by peak. I did not know this fact untill I noticed the difference of
respective output numbers as described in DIN and IEC. See also the
English part of "frequency record" (output test of 4 monaural
cartridges). In German text,
peak velocity is marked with symbol v^ while effective velocity is marked with veff.
Accordingly all the velocities (cm/s) quoted hereunder shall mean peak values if
not specified.
|
50Hz Power Supply (Mains) |
60Hz Power Supply (Mains) |
||||
| RPM | number of stripes or dots on strobe disc | drift number per minute | RPM | number of stripes or dots on strobe disc | drift number per minute |
| 77.92 | 77 | -6 to +18 | 78.26 | 92 | -38 to -10 |
| 45.11 | 133 | -27 to -3 | 45.00 | 160 | +/-14 |
| 33 1/3 | 180 | +/-12 | 33 1/3 | 216 | +/-14 |
According to JIS C5521-1975 (phonomotor test method): 100/3 revolutions at groove radius 12cm and 45 revolutions at groove radius 8cm are measured with the usual stylus pressure on each plain groove. IMO: Because of stylus pressure (& drag force) influencing on turntable, rpm would be increasing a bit toward inner groove in most turntables other than Direct Drive turntables. Diameter of the conventional Strobe Disc (around 10cm) was made similar to the label size for checking rpm with record putting on turntable. We amateurs forget this reason and feel happy to have bigger strobe disc and measure rpm without loading of stylus pressure upon record!
DIN 45538 (1969):Begriffe für Schallplatten-Abspielgeräte (Definitions for disk record reproducing equipment)
This standard defined terms such as relative deviation from nominal RPM/Wow and flutter/Margin for rumble/pick-up system/cartridge/stylus/tracking force/resilience (Rückstellkraft)/compliance/channel separation/VTA/reproduced frequency/effective stylus mass etc. 'Rückstellkraft' is defined as a force which must be overcome by stress force so that stylus tip can be moved from set position. Tracking force/Resilience/Compliance can be measured at null frequency (static) or at specific frequency (dynamic). IMO: The term 'Rückstellkraft' is identical to stiffness as 1/compliance for example 2g/100micron=980*2dyne/0.01cm=196000dyne/cm stiffness which can be converted into static compliance about 5.1*10^(-6)cm/dyne.
DIN 45541 (1971):Frequenz-Mess-Schallplatten (Frequency test record St 33 and M33, Stereo and Mono)
St 33(Stereo:side A) contains Sweep from 31.5Hz to 20,000Hz(L/R), 16 spots Signals for same range. M33(Mono:side B) contains sweep from 31.5Hz to 20,000Hz, 16 spots signals for same range and sweep from 5 to 125Hz (flutter range). 8cm/s for stereophonic recording, 10cm/s for monophonic recording were selected each as reference recorded velocity 0dB in 70's. See also DIN 45543 which amended velocity 0dB for monaural recording: from conventional 10cm/s to correct 11.3cm/s as calculated.
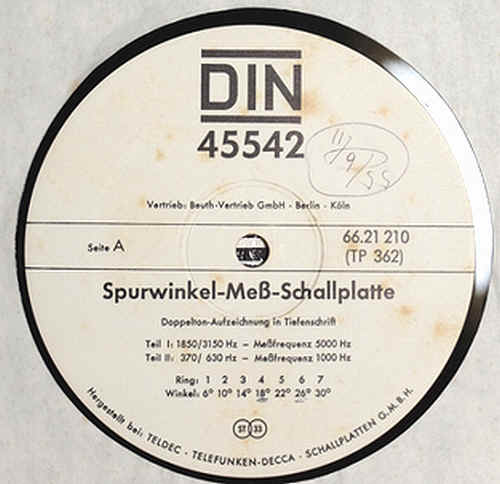
DIN 45542 (1969):Verzerrungs-Messschallplatte (Distortion test record St 33 and St 45, Stereo)
Side:A St33: recorded
vertically=hill and dale modulation Tiefenschrift, this side for the
measurement of VTA is recorded at various vertical modulation angles from 6 to
30 degrees with complex (Doppel) tones of 1850Hz+3150Hz & 370Hz+630Hz for
measuring vertical tracking angle of a cartridge. Velocity of each frequency
component is fixed at 3.8 cm/s. When the output of total tone 5000Hz or 1000Hz
is measured lowest, the ring shall indicate corresponding vertical tracking
angle of a cartridge. Vertical tracking angle measured with total
tone 1000Hz shall be declared in data sheet.
Side:B St45/33: recorded on flank(45 degrees)=Flankenschrift (vertical
modulation angle fixed at 15degree) 300Hz+3000Hz for 33rpm or nearly
400Hz+4000Hz for 45rpm for the test of nonlinear distortions with stereo
pick-ups. 0dB: f1=300Hz with velocity 8cm/s, f2=3000Hz with velocity 2cm/s, i.e.
velocity rate is 4:1 for 300Hz/3000Hz (11cm/s:2.8cm/s for nearly 400Hz/4000Hz). Playing with 33.3rpm,
frequency intermodulation distortion (FIM) can be measured by determining
the degree of frequency modulation of f2 by f1. Ortofon often declares these data for their cartridges
as FIM distortion at recommended tracking force, DIN 45542: <
1% etc. Wow-flutter/Drift meter in accordance with DIN 45507 can be applied
with this frequency pair (300Hz+3000Hz). Instead of weighting filter, switch on
RC HPF with time constant 1ms (=around 160Hz) enabling to suppress frequency
modulation (FM) caused by wow-flutter of turntable.
Playing with 45rpm, intermodulation distortions (IMD) in
accordance with DIN 45403 can be measured. Search-tone-analyser (FFT?) is
recommended since demodulation method (amplitude demodulation) may indicate
false value of distortion arising at tracing (Phase modulation). Geometric
distortion due to stylus tip shape is compensated upon recording except for two
rings - cartridge with stylus tip radius 15μm and vertical tracking
angle 15degree shall be used as standard for this test record (see my note
1). The rate of nonlinear
distortions arising at -6dB reference tone shall be declared in data sheet.
See also DIN 45549 about FIM. The publisher Beuth released test record
based on 45542 manufactured by TELDEC (recorded by DG). My Personal Notes: 1)By 1969 TELDEC (US Patent
3457374 etc) developed tracing simulator for compensating
expected geometric distortion due to the spherical stylus tip tracing on
groove. But then the respective designed curvature of spherical stylus tip must
be used? About such question JVC engineers explained in a Japanese book (1979)
that "in any case tracing distortion is reduced as if smaller tip radius is
used because |r-r0|<r (r: applied stylus tip radius, r0: designed value of
stylus curvature for tracing compensator)" see a
drawing introduced in my Japanese page about tracing simulators & recording compensators.
2)FIM & IMD. I am wondering how two
different measuring items (FIM and IMD) in accordance with speeds are possible while the
nature of recorded signals is essentially same? There have been various terms
and different approaches to modulation distortion measurement: CCIF IMD/SMPTE
IMD/DIM
(dynamic
intermodulation distortion) /Thiele IMD (total difference frequency distortion)
and so on!!!
| Side A: Vertical Tracking Angle Test with complex (Doppel) tone in vertical modulation | ||||||||
| Band | Vertical Modulation Angles | f1 (Hz) | f2 (Hz) | velocity for f1 (v1)=velocity for f2 (v2) (cm/s) | recorded time (second) | Sum tone f1+f2 (Hz) | ||
| A1 | 6/10/14/18/22/26/30 degrees (total 7 rings) | 1850 | 3150 | 3.8 | each 10 | 5000 | ||
| A2 | 6/10/14/18/22/26/30 degrees (total 7 rings) | 370 | 630 | 3.8 | each 10 | 1000 | ||
| Side B: Non-linear Distortions Test at 45degrees components. | ||||||||
| Band | Ring number within band | Channel | Relative level (dB) | recorded time St33 (second) | Remarks | |||
| B1 | 1/2/3/4/5/6/7 | L | -12/-10/-8/-6/-4/-2/0 | each 12 | ||||
| B2 | 1/2/3/4/5/6/7 | R | -12/-10/-8/-6/-4/-2/0 | each 12 | ||||
| B3 | L | -6 | 35 | Representative Level for FIM measurement | ||||
| B4 | R | -6 | 35 | Representative Level for FIM measurement | ||||
| B5 | 1/2/3/4/5/6/7 | L | -12/-10/-8/-6/-4/-2/-6 | each 12 | Geometric tracing distortion is not compensated upon recording for ring No.7. | |||
| B6 | 1/2/3/4/5/6/7 | R | -12/-10/-8/-6/-4/-2/-6 | each 12 | ||||
| St45: rotation at 45rpm for side B | f1=400Hz* | velocity 11 cm/s | 0dB | |||||
| f2=4000Hz* | velocity 2.8 cm/s | |||||||
| St33: rotation at 100/3rpm for side B | f1=300Hz* | velocity 8 cm/s | 0dB | |||||
| f2=3000Hz* | velocity 2 cm/s | |||||||
Remark* on rotations and frequencies: Recorded frequency is shown 1% lower at 100/3rpm and 1% higher at 45rpm because 45:100/3 is not exactly 4:3. My note: Exact ratio 45rpm divided by 100/3rpm =1.35, hence above four velocities for 0dB seem to be rounded approximately while frequency ratio of f1:f2 retains exact vale 1:10 and velocity ratio 4:1. |
||||||||
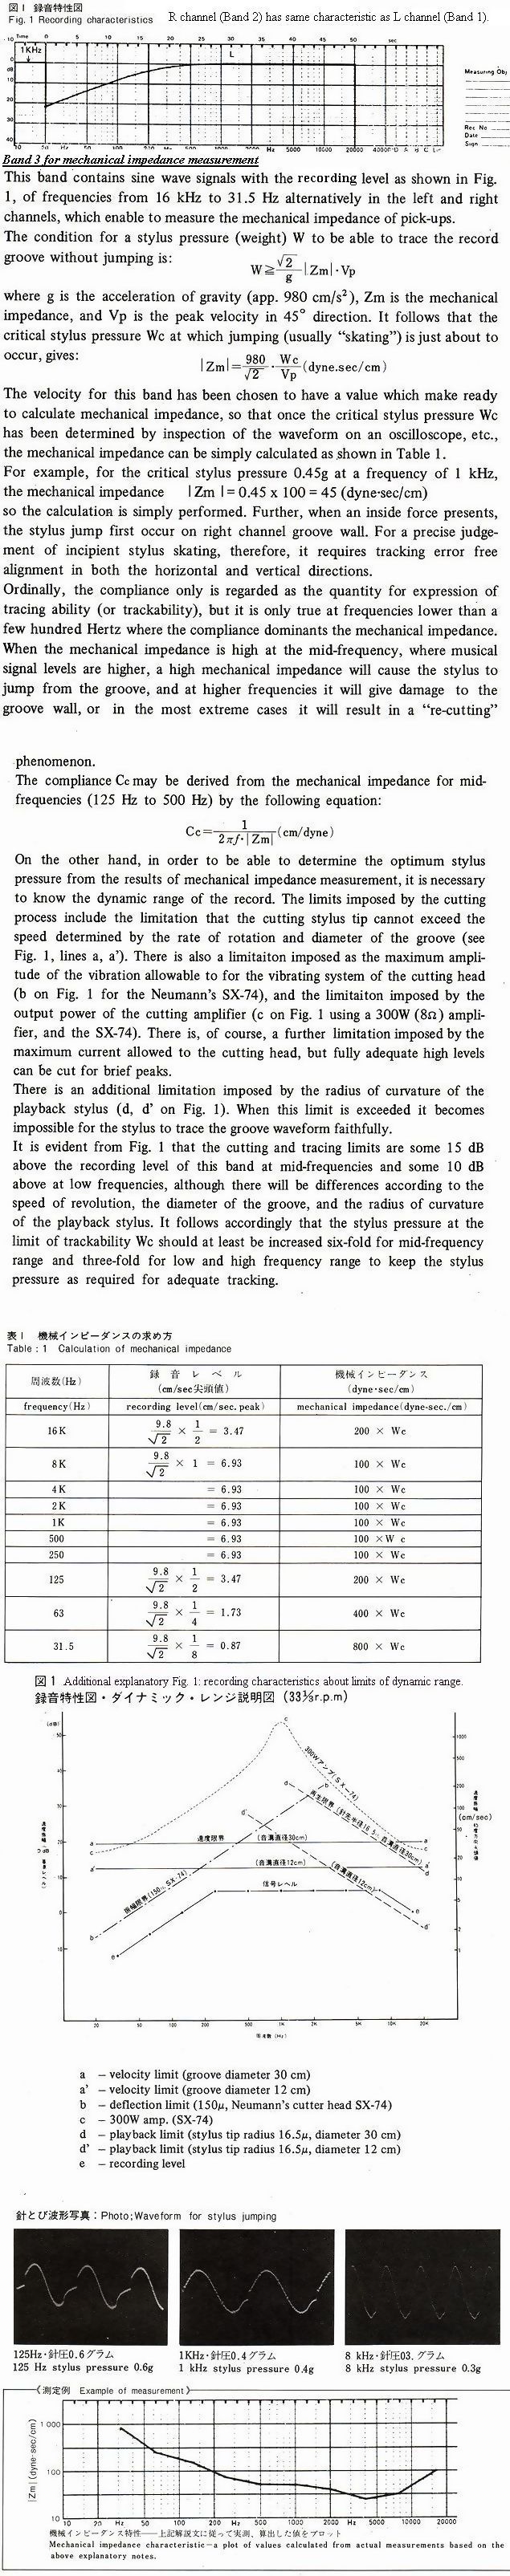
I picked up the following pictures from Yamamoto (1971). Left upside: Reproduced wave by cartridge of VTA 16 degrees tracing on test tone of 400Hz+4000Hz recorded with VMA 2.5 degrees. Left downside: Wave of 4000Hz component. Right: 4000Hz component reproduced with VTA 16 degrees cartridge on test tone 400Hz+4000Hz recorded with VMA 15degrees. The difference 13.5 degrees between VMA & VTA might be an extreme case. But it is not impossible if we consider VMA variation of stereophonic records from 15 to 23 degrees & VTA variation of actual cartridges deviating +/- 5 degrees from nominal value. [8+5=13].
DIN 45543 (1984):Meßschallplatte zur Messung des Frequenzganges und der Kanaltrennung (Frequency response and separation test record)
This record combines frequency test (sweep 20 to 20,000Hz Lateral), channel separation test (spot 20 to 20,000Hz Alternating L/R), and arm resonance test (3 to 500Hz Lateral and Vertical): thus replacing older test record DIN45541(Stereo and Mono) technically. This test record made in accordance with DIN45547-1981(Stereophonic disk record 33 1/3rpm) should have bottom groove radius smaller than 4micron and VMA 23degrees for stereophonic recordings. A test record based on this standard was produced by DGG.
| Band | Kind of Recording | Effective value cm/s | Peak value cm/s | REMARKS | ||
| Side A: signals are recorded with DIN/IEC/RIAA characteristic/time constants 3180-318-75microseconds. | ||||||
| A1 | Lateral | 8 | 11.3 | Reference Tone Level = 0dB 1kHz 15seconds | ||
| A2 | Vertical | 8 | 11.3 | Reference Tone Level = 0dB 1kHz 15seconds | ||
| A3 | Left Channel | 5.6 | 8 | Reference Tone Level = 0dB 1kHz 15seconds | ||
| A4 | Right Channel | 5.6 | 8 | Reference Tone Level = 0dB 1kHz 15seconds | ||
| A5 | Left channel | -10dB level of band A3: sweep from 20Hz to 1kHz and -20dB sweep from 1kHz to 20kHz | ||||
| A6 | Right channel | -10dB level of band A4: sweep from 20Hz to 1kHz and -20dB sweep from 1kHz to 20kHz | ||||
| A7 | L/R alternative | -20dB 1kHz | ||||
| A8-A18 | L/R alternative | -20dB spot 20kHz/18kHz/16kHz/14kHz/12.5kHz/10kHz/8kHz/6.3kHz/4kHz/2kHz/1kHz | ||||
| A19-A27 | L/R alternative | -10dB spot 1000Hz/500Hz/250Hz/125Hz/80Hz/63Hz/40Hz/31.5Hz/20Hz | ||||
| A28 | L/R alternative | -10dB 1kHz | ||||
| Side B: signals are recorded with time constants 3180-318microseconds (excluding top lift 75microsecond). | ||||||
| B1 | Left channel | -10dB level of band B5: sweep 20Hz to 20kHz | ||||
| B2 | Right channel | -10dB level of band B6: sweep 20Hz to 20kHz | ||||
| B3 | Lateral | -10dB level of band B7: sweep 20Hz to 20kHz | ||||
| B4 | Vertical | -10dB level of band B8: sweep 20Hz to 20kHz | ||||
| B5 | Left channel | 5.6 | 8 | Reference Tone Level = 0dB 1kHz 15seconds | ||
| B6 | Right channel | 5.6 | 8 | Reference Tone Level = 0dB 1kHz 15seconds | ||
| B7 | Lateral | 8 | 11.3 | Reference Tone Level = 0dB 1kHz 15seconds | ||
| B8 | Vertical | 8 | 11.3 | Reference Tone Level = 0dB 1kHz 15seconds | ||
| B9 | Lateral | -22dB level of band B7 : sweep 3Hz to 500Hz | ||||
| B10 | Vertical | -22dB level of band B8 : sweep 3Hz to 500Hz | ||||
| VARIOUS TEST RECORDS measuring output voltage or SN ratio or output difference between L/R | DENON XG-7001 & JVC TRS-1007 etc | JIS Monaural Standard Record JIS C-5507 & JIS Stereo Standard Record JIS C-5514*(see bottom explanation) etc | NAB 1964 | DIN Test record | CBS-Lab STR-100 | |
| 1kHz reference level recorded in test record | Stereo (each channel i.e., L/R alternatively) 3.54cm/sec peak for 45 degrees | Lateral 5cm/sec peak | Lateral 7cm/sec peak | Stereo (each channel) 8cm/sec | Lateral 10cm/sec peak or 11.3cm/sec (DIN 45543) | Stereo (each channel i.e., L/R alternatively) 3.54cm/sec rms for 45 degrees |
| level of each one channel (45degrees peak) peak signal velocity conversion for stereophonic pickups | 3.54cm/sec | 3.54cm/sec | 5cm/sec | 8cm/sec | 7cm/sec or 8cm/s (DIN 45543) | 5cm/sec |
| Why lateral groove is used in JIS for measuring output voltage of stereo pickups? I think it is because of measuring output difference between L/R at a time. JIS C 5503-1979(Phonograph Pickups) explained clearly "lateral peak 50mm/sec should be converted to 35.4mm/sec peak 45degrees for stereo pickups". Please note the difference in definition between relative output (mVrms for certain velocity peak or rms) and absolute sensitivity (mV/velocity in IEC definition) as explained earlier. | ||||||
1) how about the relation between 0dB & recorded velocity?
According to Vinyl Lexikon by Frank Wonneburg published in year 2000: <following
to RIAA/IEC 8cm/s for stereophonic records, 10cm/s for monophonic records and
12cm/s for MaxiSingle>.
DIN 45537(1962)Monaural Records:peak
10cm/s at 1000Hz with the reservation that its value is to be approved
internationally. Later
10cm/s for monaural 1kHz test tone is replaced by 11.3cm/s. Often readers &
writers misunderstand the true intention of documents and overlook the time
when these documents were made (funny enough standards for vinyl records are
made a few years after the appearance of new products).
DIN 45547(1981)Stereophonic Records: effective
5.6cm/s (=peak
8cm/s) at
1000Hz
Any velocity level was optional/stopgap because to get same output level from
stereo & monaural grooves with
stereo cartridge:
stereo one channel recorded velocity towards 45degrees = monaural velocity/√2.
Hence 8x√2=11.3cm/s for monaural recording is indicated in the above table
from DIN 45543. Old 10cm/s might be derived from 7cm/s(NAB)x√2. Of course these are again optional and another pair (Stereo
channel-wise 3.54cm/s 45 degrees and Mono 5cm/s laterally) can be selected as
reference 0dB as often applied on cartridge sensitivity test. Each 0 dB level
can be different in every test record according to the purpose of measurement:
I prefer the description in velocity (cm/s) than obscure dB. 0dB as recording
level index cannot be standardised since the
actual recording level should be determined backward from the conventional
ability
of cutting machines and pick-ups.
2) how to measure recorded velocity?
According to IEC98: the alternating velocity that a rotating disk would impart
to the stylus of a pick-up having low
mechanical impedance and negligible dimensions of stylus tip.
Such perfect cartridge is not yet existing! Hence the recorded velocity of a
sinusoidal groove modulation may be measured with an optical method (the
Buchmann-Meyer light-band method measuring the width of reflected light
patterns). G. Buchmann und E. Meyer, Eine neue optische Messmethode fuer
Grammophonplatten. Electrische Nachr-Techn. 7(1930). Another method is based
on the theoretical/geometrical value of velocity: Peak
Velocity for sinusoidal modulation = amplitude or displacement of modulation
from centre (0 to peak)*2pi*frequency. For
instance "recorded velocity" 3.14cm/s: 5micron amplitude for 1kHz, 50micron for 100Hz and so on.
DIN 45544 (1971):Rumpel-Meß-Schallplatte (Rumble measurement test record St 33 and M 33, Stereo and Mono). The measuring method is based on DIN 45539.
Side
A: Stereo L flank/R flank & Vertical/Lateral Recordings 315Hz with peak
velocity 5.42cm/s and long plain groove until minimum diameter 120mm with normal recording
(dense) pitch to
test motor rumble.
Side B: Lateral=Monaural Recording 315Hz with peak velocity 0.54cm/s and long
plain groove until minimum diameter 120mm with pitch 0.54mm/turn (=0.3mm/s).
By
using level recorder: check rumble voltage, the strength of acoustic feedback
on turntable case or the influence of
auto-stop depending on groove radius.
The rumble voltage ratio=20log10(output at
315Hz peak 5.42cm/sec divided by output at mute groove)
There is a reference to NAB-recommendation in March 1964.
It is said that NAB's values (100Hz peak 1.4cm/s laterally recorded monaural) are
lower than values measured with this DIN test record: about -4dB for monaural
equipment and -7dB for stereo equipment because of velocity difference converted
to 1kHz output and the nature of groove modulation (DIN/IEC=Stereo 315Hz while
NAB=Monaural 100Hz). Moreover the measured value according to NAB is unweighted
only. 315Hz is selected because it is the limit of weighted curve as well
as linear section for evaluation. Peak velocity 5.42cm/s is selected because it
is comparable with velocity 10cm/s at 1kHz after passing IEC/RIAA equalization
(time constants 3180/318/75microseconds). But -5.32dB(=5.42/10) as
recording difference between 315Hz and 1kHz was not exact! Hence accurate value
5.51cm/s for 315Hz based on recording difference -5.18dB is adopted later
in IEC98(1987). IEC 60581-3(1978) also indicated 3.83cm/s rms (5.42cm/s
peak) based on old data from original RIAA etc before computer
calculation based on time constants became easy. The specific
recording/reproducing dB point at 300Hz instead of 315Hz had been indicated in
early documents and in early 1970s someone estimated dB for 315Hz and this incorrect figure
had been used repeatedly without checking. Now exponential divisions are
systematically adopted for frequency table i.e., x1.25 etc and/or rounded to
near integral numbers such as 100, 125, 160, 200, 250, 315 and so on because
each division has almost same distance on semilogarithm chart. The correct recording/reproducing dB
for 315Hz was indicated as 5.2dB (rounded from 5.179) in IEC98(1987). IEC98(1964)&BS-1928(1965) indicated correct
curve
for 20Hz-20kHz while the recording curve presented in DIN 45537-1962(Monaural LP
record) had irregularity for 30Hz-200Hz (30Hz -17.5dB in DIN45537-1962 vs
correct value -18.6dB in DIN45547-1981 for stereo LP) whereas time constants for
these standards remain unchanged irrespective of mono or stereo application. We
find this kind of small deviations in old documents. It was already known in
Japan by 1973 that original RIAA dB numbers had irregularity - JIS S 8502-1973
indicated correct dB up to the second decimal.
My note: SN rates are
actually differing by the radius of mute band to be tested. This point is
neglected in recent test data. In many cases SN ratio at inner groove is better
than SN ratio at outer groove. I suppose some reasons:
A: Height variance due to warp
might be small toward inner radius of record.
B: Stylus
friction on a groove might become small as per groove velocity in contradiction
with the usual theory of kinetic friction.
C: Unbalance on
revolving platter due to the stylus pressure is decreasing toward inner groove.
Rumble due to
mechanical imperfection at turntable together with Hum due to electric
induction mainly at pick-up system can be measured as SN. For
example: Playback output of certain signal groove measured as 5mV, playback
noise of plain groove measured as 10μV, then SN ratio is calculated as
54dB. I think SN ratios more than 35dB unweighted and 55dB
weighted as demanded in DIN 45500(1975) &IEC 60581-3(1978) are practical
enough as minimum performance target: it is in vain to seek extraordinary big
numbers since the SN ratio of vinyl records [due to lacquer's particle size
more or less 50 angstrom and vinylite composition with additive such as carbon black powder
etc] is usually under 65dB at 1kHz weighted by
hearing curve and under 50dB unweighted. I am astonished to read the technical
leaflet attached to Denon test record XG-7001: "This band consists of
non-modulated grooves that are provided for the purpose of measuring the
signal-to-noise ratio of the sound system...If these grooves were to have been
cut using a common cutting head, there would ensue noises such as hum, so a
special non-modulated groove cutting head without any moving
component was assembled and used to cut these grooves." I don't know how
about the plain grooves in other test records for measuring SN ratio. Anyway a
deformation-free dust-free plain groove is required for SN measurement.
IMO:
I. It is of no use to measure mechanical rumble
alone. II. The
"rumble" is an obsolete term since any modern turntable don't make
audible rumble as in the early times.
Some methods to check mechanical imperfection
or strength as the deflection of the revolving plate were presented in JIS C5521-1975 (Testing Method for Record Turntables)"
as follows:
Each measurement is tested for turntable excluding record mat
(i.e. bare platter).
Measure with dial gauge (high sensitive type with measuring pressure requirement
less than 30g).
(1) Static height variance: Without rotating a turntable, put 50g weight at the
radius 125mm on turntable and then shift the weight to the opposite place
(125mm). And check the height variance of turntable at radius 125mm. Weight 50g
is selected in consideration of the current VTF less than 10g and safe rate as x
5.
(2) Revolving height variance: With rotating turntable, check the height
variance at 10mm inside from the rim of a turntable.
(3) Revolving lateral variance: With rotating turntable, check the lateral
variance at the rim of a turntable.
Each Evaluation of (1) & (2) : The deflection of turntable =height variance
at testing point (mm) /testing point (mm) on a turntable.
Though these
JIS methods can check mechanical imperfection or strength, the method (1) is not
suitable for turntable with floating suspension. According to a test
report found in Japanese audio magazine around 1980 about first-class 11 turntables from the world (various
drives: DD/BD/Idler and various suspension and construction), static height
variance according to test (1) was maximum 0.04mm, revolving height variance
according to test (2) was maximum 0.23mm and lateral variance according to test
(3) was maximum 0.21.mm. These figures are negligible if compared with mat
flatness and record warps.
Besides above JIS, in 1978 Thorens supplied a
Rumpelmesskoppler (rumble test coupler maybe inspired by Rabinow's
USP3653255-1972) to measure mechanical rumble noise arising from spindle (literal
"rumble") - as a result generally 6dB to 10dB higher SN
comparing to conventional method using test record could be indicated by this
method (free from the quality of a test record). Hence I believe that any
modern turntable is free from a mechanical rumble and its SN is mainly
influenced by the electrical circumstances. SN is changing in accordance with
actual arrangements and nominal SN indicates only potential under ideal (not
hearing, only measuring) conditions - it is unreal for users who play
records under non-ideal conditions (various acoustic/mechanical feedback upon hearing).
Aforementioned Japanese testers (using both conventional test record and rumble
coupler) reported interestingly that the measured SN ratio
was affected by conversation in the same room (the turntables to be measured
were placed on anti-seismic board).
| Band | Kind of Recording | Effective value cm/s | Peak value cm/s | REMARKS |
| Special remark*: current test records for the time being have 10seconds recording of each signal for side A and 3 seconds recording for side B. It should not be produced anew when new test record is arranged to be made. | ||||
| Side A: Rumble Test Record as per DIN 45544 | ||||
| A1 | Left Channel | 3.83 | 5.42 | 315Hz for 15seconds* |
| A2 | Right Channel | 3.83 | 5.42 | 315Hz for 15seconds* |
| A3 | Vertical | 3.83 | 5.42 | 315Hz for 15seconds* |
| A4 | Lateral | 3.83 | 5.42 | 315Hz for 15seconds* |
| A5 | Mute band | - | - | Long plain groove with normal dense pitch to minimum radius 60mm |
| Side B: Rumble Test Record as per DIN 45544 | ||||
| B1 | Lateral | 0.38 | 0.54 | 315Hz for 15seconds* |
| B2 | Mute band | - | - | Long plain groove with pitch 0.54mm/turn (=0.3mm/s for synchronising level recorder on paper) to minimum radius 60mm in order to pinpoint the radius where an obstacle occurs. |
| Record for Rumble Test according to IEC98(1987) | ||||
| Modulation | Frequency Hz | Effective value cm/s | Peak value cm/s | Time in second |
| Left Channel | 315 | 3.90 | 5.51 | 15 |
| Right Channel | 315 | 3.90 | 5.51 | 15 |
| Vertical | 315 | 3.90 | 5.51 | 15 |
| Lateral | 315 | 3.90 | 5.51 | 15 |
| Mute band | - | - | - | |
| Remarks: 315Hz is selected because
it is located at the peak of weighted curve as well as in linear section
of unweighted evaluation curve. Under the proposition that 1kHz
reference signal velocity is 7.07cm/s eff. (10cm/s peak), the recorded
velocity 3.90cm/s eff. (5.51cm/s peak) at 315Hz
is equivalent with velocity 10cm/s at 1kHz in recording characteristic
(time constants 3180/318/75 microseconds). In the same way different frequency other than 315Hz can be selected for rumble test. For example: JIS C5521-1975 (Testing Method for Record Turntables) "signal lateral 5cm/s peak at 1kHz is selected for both SN measurement and reference tone for checking the cartridge output though it is equivalent to 45/45 velocity 3.54cm/s peak (2.5cm/s eff.)." In old JIS monophonic test record based on C 5507 before 1971, an additional groove 100Hz peak lateral velocity 1.1cm/s was included. Outputs after equalization should indicate similar values between two bands (5cm/s at 1kHz and 1.1cm/s at 100Hz). When measuring unweighted S/N of same turntable using IEC(1987), DIN(1971), JIS(1975) and NAB(1964) test records, each SN value should be ranking as IEC>DIN>NAB>JIS because of the amplitude difference of the recorded signals after equalization. Current popular specification is based on DIN 45539 (weighted)=IEC98A 1972(weighted) with sharp evaluation filter at 315Hz. Old JIS and NAB methods are virtually unweighted. In JIS method around 60dB is maximum reflecting the S/N of record itself. Noise component can be reduced with tracing on flat glass or blank lacquer plate. DIN/IEC rumble test records contained Lch/Rch/V/Lateral recordings. S/N for lateral recordings should be better than others generally but usual specifications would indicate opportune values abusing standards. Minimum S/N should be indicated as more than xx. DIN is still preferred to IEC because IEC98(1987) recommended to indicate worst value (biggest noise component) for S/N measurements. We should not be deluded with superficial specifications or big numbers appealing to innocent/ignorant consumer. |
||||
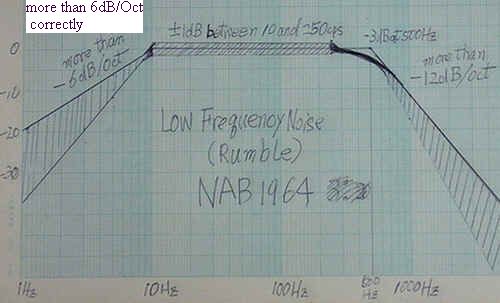
DIN 45539(measuring method)&DIN 45544 (rumble test record) both March
1971 were later accepted as international standards. Filter for unweighted curve was
modified a bit in IEC98-1987 since low frequency resonance between arm mass and
cartridge compliance might affect the unweighted measurement. Left from DIN
with my additional remark 6dB/Oct filter versus Right from DIN IEC 98 issued in
1989 as German translation of IEC98-1987. It seems that the subsonic
filter of rumble measurement as per IEC98-1987 was made as a compromise between
DIN 45539-1971 and JIS C5521(band-pass filter 300Hz-6dB/Oct &
sharp subsonic filter 30Hz 24dB/Oct or 40dB/Oct applying to the output for a
plain groove at radius 120mm for LP and at radius 80mm for EP). I
make NAB bandpass filter visualised with handwriting. I find a cool passage in
this NAB(1964): "This
measurement is intended to give a measure of electrical effect of the
low-frequency noise output of a turntable pickup combination. Since the result
depends on the equalizer, pick-up and arm characteristics as much as on the
turntable itself, it is not feasible to standardize a turntable alone. The
measurement reflects the electrical effect, not the aural annoyance value, of
the low-frequency noise. It has been found that strong low-frequency noise at a
frequency and intensity below audibility may create severe intermodulation
distortion in an audio system, and that in modern systems with extended low
frequency response, this may be more serious than the audibility of the low frequency."
I prefer the term "SN for a whole system" to "mechanical
rumble". Usually weighted S/N only is indicated since its number is
around 20dB higher than unweighted S/N. I cannot understand the meaning of
weighted S/N since motor rumble & its acoustic coupling to
plinth/arm/mat is lower than 315Hz: mostly 10Hz-250Hz. Then what is the use of low cut filter
from 315Hz? Hence spectrum analysis method has been recommended by some testers
(Yamamoto in 1971 & Ladegaard in 1977 etc). Also in IEC98A-1972, beside
conventional Method A for general use, Method B applying spectrum analysis
instrument was introduced as follows: "(This method is intended for
specialists' use, when an analytical result is required)...By means of a
measuring instrument, the voltage Uo produced by the reference signal is
measured at the output terminals of the one-third octave filter whose
mid-frequency corresponds to the frequency of the reference signal. A search is
thus made across the frequency spectrum determined, and for each of the bands
concerned, the voltage U at the output terminals of the one-third octave filters
are measured and the ratios 20 log U/Uo are determined."
There are two routes of
coupling or feedback within a turntable system: I. motor - driving mechanism -
platter - mat - record - cartridge - arm and II. record - cartridge - arm
- turntable board/plinth. I & II are in a loop. In
my test using Mechanic's Stethoscope during playing record I could hear music clearly on
arm-base while the noise at spindle was not clear. Hence I suppose friction
noise between stylus and record is more troublesome than turntable spindle noise.
Sometimes electric transformer and high-speed motor for belt or rim drive
produce higher vibration although they are suspended by rubber usually. I think
the reason for higher S/N for DD drive might be its low-speed motor centered at
spindle while other drives push platter and spindle to the side wall of bearing
sheath
so that maintenance for lubrication is required periodically. DD with
oil-sintered bronze for bearing sheath is maintenance-free for years. We find
the pro and con debate on specific driving method, but driving methods are
hardly related to sound quality though one can have fixed ideas or delusion.
One holds/appreciates what one has (ceremony of wedding?). Actual sound difference if any is arising from turntable construction (cabinet
supporting arm/turntable/motor, plinth/cushion and the stiffness of mat) and
the location of turntable system.
A or x curve to be applied on the output from a mute band: unweighted
for 20Hz-315Hz for measuring Rumpel-Fremdspannung=Rumble interference
voltage
B or y
curve to be applied on the output from a mute band: weighted with high
and low cut filters from 315Hz for measuring Rumpel-Geraeuschspannung=Rumble noise voltage
My note: In these DIN/IEC graphs, symbol +/- for dB/Oct is
omitted conventionally.
Above JIS comment "no gurantee for S/N under 30Hz" is
puzzling. It may indicate the limit of recording (cutting system for lowest
frequencies could not have enogh MFB to cutting head). Recording of mute groove (0Hz)
had not perfect plain surface actually.
The evaluation of SN for record itself is limited
to 500Hz-10kHz etc as shown in JIS S8502.
Hum measurement as per IEC98 (1987): Use the same record as the Rumble test (315Hz velocity 5.51cm/sec using L/R/Lateral modulation) and calculate The hum voltage ratio =20log10 (cartridge output at 315Hz peak 5.51cm/sec divided by hum induction output) separately for L/R/Lateral. When measuring hum voltage, the stylus point should be located in the range of radius 5-15cm from the centre of spindle, and the needle should be setting 2.5mm above revolving platter (locating the stylus point virtually at the same level of playing actual records, no mention on record mat ???). Check the left and right channels and indicate the minimum (= worst value) for stereophonic system. IMO: The various shielding states of cartridges influence this hum ratio in actual measurements so that hum rate is not specified in recent products. In JIS C5521-1975 (Testing Method for Record Turntables) definitive method for measuring hum induction level using spherical search coil instead of cartridge is presented, but I never know it is applied actually. SN measurement as the result of whole system is already enough though SN ratio is also influenced by actual circumstances such as mat/cartridge/arm/cable/step-up transformer etc besides turntable.
DIN 45545 (1966):Gleichlauf-Meß-Schallplatten für 33 1/3 und 45 U/min (Wow and flutter test records for 33 1/3 and 45 rpm)
These records are applied for measuring wow and flutter based on DIN 45507(measuring equipment for frequency fluctuation) and DIN 45539(measuring method). Measuring frequency recorded horizontally is 3150Hz. Record itself shall be manufactured within ±0.06% (unweighted about ±0.12%) fluctuation of frequency. And wavy height change hindering optimal centering by means of using the concentric groove shall not exceed 0.3mm. The test record based on this standard was assigned to DGG.
W&F
evaluation curves: left as per DIN & right as per old JIS before 1972 for
example. NAB & JIS C5521-1975 adopted DIN/IEC
evaluation curve though there remained difference in expression among
peak/rms/mean. Anyway usual W&F analog meter will rectify the signal (with a
special slow-quasi-peak full-wave rectifier designed to register any
brief speed excursions) so that they have essentially same meaning relatively,
only showing different numbers: theoretical rate 1/0.707/0.636 for peak/rms/mean
respectively in case of sinusoidal modulating frequency. For example JIS
0.25%rms is equivalent to DIN/IEC 0.35%peak. We cannot compare the measured
specifications of equipments without knowing the measuring method and its
evaluation curve. Though this measuring method with W&F meter is established
and accepted widely, one can doubt its efficiency because it is based on
"slow-quasi-peak full-wave rectifier". Also there is the battle among measuring
methods. J.Mcknight (Ampex) reported in IEEEM (1972) (here the term
"flutter" covers wow and flutter): "The old IEEE/ANSI flutter measurement standard did not
predict subjective flutter; it also failed to specify several important
characteristics of the meter. Comerci proposed a "flutter index"
method but it was never adopted. Results of several workers were incorporated in
1962 in a German Standard (DIN) Weighted Peak Flutter measurement. The NAB
flutter measurement of 1965 incorporates the frequency weighting of the DIN
Standard, and the volume indicator of Comerci. CCIR adopted the DIN method in
1966. Experiments in the U.S.A. comparing the DIN and NAB methods showed the DIN
method to be more satisfactory, and this method is incorporated in the new IEEE
Standard 193-1971, based on an IEC draft. Circuits to achieve the desired time
and frequency responses are given, as well as suppliers of commercial flutter
meters and test records to the new standard."
Test signal must be
recorded laterally because vertical or one channel recording might indicate
other factors than wow & flutter of turntable: the movement of stylus on
sticky record may be affected more in vertical or one channel recording than
lateral recording. In my experience, the wow&flutter values measured on
test records are not reflecting the status of wow&flutter in hearing the
usual (dirty/sticky) records. Sometimes after cleaning contaminated record and
stylus, I find the wow&flutter as well as the amplitude of low frequency
resonance is reduced to some extent. Stylus drag cannot be made null in stylus
tracing method, but it can be reduced to some narrow range after cleaning
records. Hence load specification 80g for instance in direct drive turntable is
of no importance. Even if the turntable is rotating at constant speed under
fluctuating load (random frictional forces) by the stylus drag, the movement of stylus is nevertheless
affected by the stylus drag itself. This aspect of stylus/cantilever movement is
often called as "stick-slip behavior/motion".
BTW: Have you
heard Laser Turntables by Finial/ELP? They have no stylus and no stylus drag
since their pickup method is optical (the nominal diameter of laser beams each 2
micron). It is innovative and free from various mechanical problems of stylus
tracing method. However I feel the reproduced sound by Laser Turntables noisy because they are
apt to be influenced by fluffy dust. Hence they are promoting record cleaning
machine together with turntable. In usual stylus tracing method, mineral dust is
more disturbing than fluff (stylus with considerable VTF can wade or plow
fluff). There are mainly two types of dust:1) Fluff produced by our living 2)
SPM (Suspended Particulate Matter under 10micron) containing rock-mineral
(quartz etc) and clay-mineral (mica etc). Dust becomes sticky when they are
combined with oily matter evaporating at cooking or smoky particles by smoking
tobacco etc. You shall not touch recorded area by hands lest friction between
stylus and groove might be increased by fingerprints and sebum collecting dust.
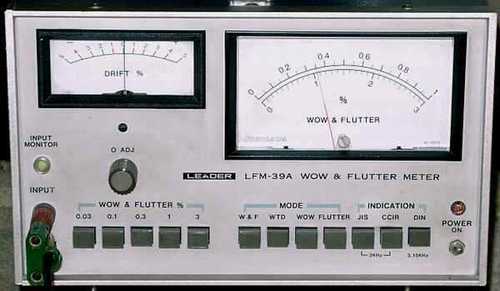
Example
of unweighted & weighted filters (Leader LFM-39A manufactured in 1979 so that
filters are same as DIN).
I tested my old equipment (cassette and
turntables) - See my Japanese Page. In my test,
cassete tape recorder/reproducer had higher rate of flutter over 6Hz compared to
turntables (maybe due to "scrape flutter" of elastic tape). Meanwhile, both
cassette reproducer and turntables had similar rate of wow under 6Hz (around
0.05%). In case of turntables, the centering of test record is affecting
measured wow rate critically. Lower flutter over 6Hz in case of turntable
is natural result from higher rotational inertia of rotor+platter+record. IMO:
Record stabiliser/weight has not increased inertia so much [W&F rate is
unchanged] while the added weight will increase the friction at turntable
spindle.
| Specifications of wow-flutter meter for example | Band-pass Filters : Unweighted | ||||
| Standard | Hz | Value | W&F range | HPF | LPF |
| NAB | 3k | Mean | 0.5-200Hz | 0.5Hz 6dB/Oct | 200Hz-15dB/Oct |
| JIS | 3k | RMS | 0.5-200Hz | 0.5Hz 6dB/Oct | 200Hz-15dB/Oct |
| CCIR | 3k (3.15kHz) | Peak | 0.3-200Hz | 0.3Hz 6dB/Oct | 200Hz-15dB/Oct |
| DIN | 3.15k | Peak | 0.3-300Hz(0.3-200Hz) | 0.3Hz 6dB/Oct | 200Hz-15dB/Oct |
| IEC | 3.15k | Peak | 0.3-200Hz | 0.3Hz 6dB/Oct | 200Hz-15dB/Oct |
Conventional measuring process of W&F: 1) reproduce the recorded signal 3kHz or
3.15kHz with cartridge or magnetic head 2) input the reproduced signal to
measuring instrument > amplifier of signal > discriminate (separate) fundamental
frequency (3kHz/3.15kHz) from modulating frequencies (W&F) > (test terminals for
oscilloscope) > add or not add evaluation curve for hearing compensation > DIN/JIS/NAB switches
for indicator (analog meter). IMO: DIN/JIS/NAB switches are
converting amplitude for indicating 1(peak):0.707(rms):0.636(mean).
CCIR(3kHz
input) position of LFM-39A has no difference from DIN(3.15kHz inut) posityion
since both adopts peak value. Hence comparable between JIS and CCIR as DIN for
3kHz source.
LFM-39A is equipped
with 4 sets of test terminals: OSC OUT 3kHz/3.15kHz, TO SCOPE AC, TO RECORDER
DC.
W&F
is similar to FM waves: original signal (music component) modulated by other
frequencies (W&F component).
My note
on conventional W&F meter. Why fundamental 3kHz or 3.15kHz is selected? It
is said that the sensibility peak of human ears is located around 2kHz-3kHz.
Moreover if fundamental frequency is nearer to modulating frequency, then more
sharp LPF is required otherwise W&F 0.1% (-60B) cannot be measured. The
reason why modulating frequency upto 200Hz is enough might be another story
(acoustic psychology). The acoustic psychology (tests carried out by Eberhard Zwicker
in 1952 and NHK in 1955 etc) tells us that human ears are most sensitive to wow
(modulating frequency) 3-6Hz so that weighted curve for hearing compensation is
decided. Upon my hearing of FM waves generated experimentally, even through PC
speakers I can hear clearly WOW of 3-6Hz upto -50dB=0.3% as something like
beating echo sound while I could not discern W&F of any frequency at less
than 0.1% - thus I can reconfirm conventional theory: "there is no real
problem in sound quality as far as continuous W&F (excluding any peaked
thrust from groove irregularity) is lower than 0.1%". I suppose this is
the reason why IEC recommends groove eccentricity to be within 0.2mm. Wow caused
by 0.2mm eccentric groove: 0.14-0.33% for music band for LP can be reduced to less than 0.1%
weighted with hearing compensation=1/3(-10dB at 0.55Hz according to chart). The minor
frequency difference between 3kHz and 3.15kHz is negligible because the filter
band of W&F meter can handle centre frequency +/- 10% as input. Usually the
measured figures weighted with hearing compensation (evaluation curve) is
indicated as representative value.
When the frequency counter is mounted on
W&F measuring instrument, its counter shows centre frequency so that it works as drift meter
(indicating average frequency in certain time scale)- I could not see any swing
of drift meter during my measurement of W&F by above instrument. Frequency
counter with smallest "gate time" is required to see actual rapid frequency
variation, hence it is impossible to measure wow-flutter
by usual rpm meter or frequency counter (indicator of the normalised results
after sampling within gate time). Some
W&F meters can indicate W&F unweighted/W&F weighted/Wow/Flutter
separately in combination of indication JIS/DIN/NAB etc. 0Hz-6Hz as wow and
6-200Hz as flutter in many conventional W&F meters (when modulated with
threshold frequency 6Hz and 1% amplitude, meter shows 0.7% each for wow and
flutter). Meanwhile current IEC calls 0.1Hz-10Hz as wow range and over 10Hz as
flutter range. Now IEC standard based on DIN remains valid. Nobody care about
the end of standards: Almost all JIS standards about analog records and
equipment were stamped as "abolished" by 1984 or 1994 at the latest while some
old standards are walking alone as living ghosts without knowing their death.
IEC would adopt 20 years rule from last revision then IEC98(1987) too becomes
such living ghost.
Conventional W&F measuring method in order to get simple numbers is almost dated because W&F and rumble and low frequency resonance are involved in sound quality. JVC applied for Japanese patent 1981-47903 (patented as 1279820) proposing test record 3Hz-125Hz (vertical amplitude 20 micrometers) sweep superimposed with 3kHz or 3.15kHz. Its measuring method: reproduced sound>flat amplifier>W&F meter>(discriminated frequencies)>recorder. What is notable in this documents: "In some cases the low resonance between cartridge and arm does not affect the higher frequencies of music while in other cases the heavier intermodulation and degradation in sound quality arise from rather flat response of lower frequencies". This method intends to know the sound quality of record player as system including arm and cartridge. I think Ladegaard already proposed similar measurements in his Audible Effects of Mechanical Resonances in Turntables (AES Convention 1977) which is downloable from Vinyl Engine as article. You cannot get simple numbers by these methods, but are able to know the sound quality reproduced by record player as system. In my experiment too the W&F waves look different among cartridges even if the W&F rate is similar (I suspect FIM of cartridge in operation is much different from nominal value - frequency dependant). Each reproduced sound results from unique compound of several factors.
DIN 45549 (1980):Abtastfähigkeits-Meßschallplatte (Tracking ability-test-record)
Object:
In the first place this test record shall be applied for trackability test at
315Hz and 10kHz. It covers supplementary tests for trackability in mid
frequencies for FIM measurements, sensitivity and rectangular modulation.
Vertical modulation angle is 23degree for stereo recorded bands except B9-B16
monaural bands which are recorded laterally/sidewise=Seitenschrift. Bands
A1-A2: 1kHz effective velocity 5.6cm/sec(=peak 8cm/sec) as reference tone, Bands
A3-A7: pulse 10kHz with a 250Hz repetition, peak velocity 8-20cm/s interchanging
between L/R for pulse test. Bands A8-12: 300Hz/3000Hz (4:1), 300Hz component
peak velocity 4-10cm/s interchanging between L/R for frequency intermodulation
test (each 2.5dB up for 400/4000Hz when playing at 45RPM instead of 33.3RPM)-
see DIN 45542. Bands B1-B2: 1kHz effective velocity 5.6cm/sec(=peak 8cm/sec) as
reference tone. B3: Rectangular wave 1kHz cut as triangle with amplitude 11μm.
B4-B8: complex (Doppel) tone of 1.8kHz+2.2kHz (1:1) momentary peak velocity
10-25cm/s interchanging between L/R. Bands B9-16: 315Hz peak signal amplitude 50μm-120μm.
Distortion rate in high frequency is measured with pulse 10kHz/250Hz while
trackability in low frequency is measured with high amplitude horizontal
recording of 315Hz. The distortion for high frequency after passing special
filter shall be Dh=U(250)/U(10000) x 100 in %. I saw similar equation in
leaflet attached to Shure Test-record TTR-103
(45rpm)
(10.8kHz pulsed high frequency test with a 270Hz repetition). In low-frequency
test Shure TTR-103 indicated Amplitude Intermodulation Distortion with
400+4kHz at 45rpm based on SMPTE (Society of Motion Picture & Television
Engineers) method. Quite different measuring methods for IMD measurement are
imaginable: record Pink Noise excluding certain bandwidth and compare it with
reproduced output range to measure distortion fallen in the band. Simple
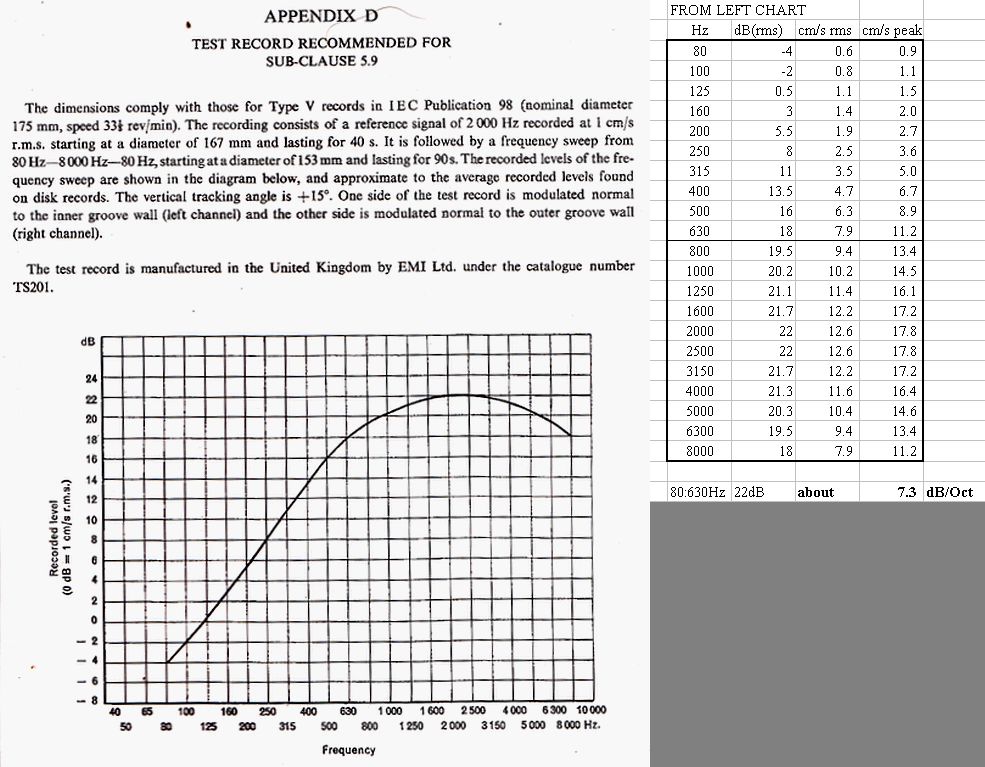
method for measuring tracking ability was once indicated by IEC98A in 1972 which
defined the tracking ability as the minimum tracking force required to maintain
contact between reproducing stylus and both groove walls on a given test record
having "the average recorded levels found on disk records"(45
degrees R or L one channel sweep 80-8000-80Hz: max 18cm/s peak around
2kHz) I imagine two objections: 1) The cartridges with highest compliance
and lowest VTF are not always having highest tracking ability. In my diabolic
definition: High-compliance cartridge is a type of cartridge which cannot endure
drastic change of VTF. 2) What are the
average recorded levels? Practically for tracking ability test, some audiophiles use
the specific bands of commercial records which contain the difficult part
(mostly high frequency & high amplitude passage with sibilant sounds) for
cartridges. Hence the tracking ability tests are developed to more complicated
methods maybe based on Shure: "A Practical High-Frequency Trackability Test
for Phono Pickups" JAES in April 1972 etc. IMO: Tracking ability test in
98A in 1972 was based on average (its moderate intention is known
from test record size 7inch and speed 33.3rpm) while the advanced methods are
based on the extremity (as some audiophiles demand). Once I found difficulty in obtaining average
performance reproducible everywhere & anytime as some old British Standards
(rpm of car engine) require, whereas other standards allow to indicate maximum performance
under optimum or optional condition. I don't know which is
more user-friendly, but audiophiles are usually fond of extreme rate.
Current IEC 60098 Clause 14.9 Trackability is suggesting to use three
kinds of test signals:
-A. Trackability at low-frequency with 315Hz/Horizontal
Modulation. Its performance is indicated by max. amplitude in mm up to which
a cartridge at recommended tracking force can trace without apparent distortion and
tracking problem. The smaller rate of amplitude shall be adopted when the
performance differs between channels.
-B. Trackability at low-mid frequency with sweep from 1kHz to
20Hz/Horizontal Modulation. The output of these frequencies are equalised with
IEC/RIAA reproduction characteristics so that the output voltage is stable
within these frequencies. Hence velocity shall be indicated along with
respective frequency measured. Its performance is indicated by max. velocity in cm/s up to
which a cartridge at recommended tracking force can trace without apparent distortion
and tracking problem. The smaller rate of velocity shall be adopted when the
performance differs between channels.
-C. Trackability at high-frequency with pulse 10kHz (with repetition at
250Hz) LRLRLRLRLR. The output is amplified linearly and then filtered into
components. Its performance is indicated by max. velocity in cm/s up to
which a cartridge at recommended tracking force can trace without excessive distortion
and tracking problem. The smaller rate of velocity shall be adopted when the
performance under the specified distortion rate differs between channels. Also
distortion rate in high frequency shall be indicated.
Why impulse instead of continuous 10kHz recording? I suspect that continuous
10kHz recording at very high velocity can burn out driving coils of cutterhead
as specified by Neumann SX-74 with cutter drive logic SAL74 as under. Lateral
28.5cm/s peak can be converted to stereo (45 direction) around 20cm/s peak. Even
if juvenile cutting engineers fumble with Neumann and try to record continuous
10kHz 20cm/s, the cutting system can remain undamaged as far as cooling
equipment is added.
| Band | Kind of Recording | Effective value cm/s | Peak value cm/s | REMARKS |
| How to use this test record: linear flat amplifier (without RIAA/IEC reproducing characteristics) should be used. | ||||
| Side A: Tracking Ability Test Record as per DIN 45549: A test record based on this standard was produced by DGG. | ||||
| A1 | Left Channel | 5.6 | 8 | Reference Tone Level = 0dB 1kHz 15seconds |
| A2 | Right Channel | 5.6 | 8 | Reference Tone Level = 0dB 1kHz 15seconds |
| A3 | L/R | 5.6 | 8 | Impulse Test 10kHz
with repetition at 250Hz: (every packet of impulse:
8wavesx10kHz+mute=10kHz0.0008s+mute0.0032s)
L/R interchanging every 20 seconds |
| A4 | L/R | 7.1 | 10 | |
| A5 | L/R | 8.8 | 12.5 | |
| A6 | L/R | 11 | 16 | |
| A7 | L/R | 14 | 20 | |
| A8 | L/R | 2.8 | 4 | FIM (frequency
intermodulation) Test 300/3000Hz (4:1), the velocities of 300Hz
component are as indicated in left column.
L/R interchanging every 12 seconds for 33 1/3 rpm By rotating at 45rpm, test signal approx. 400/4000Hz and L/R interchanging every 9 seconds [EP/LP=rpm ratio 1.35, 1.35x300Hz=405Hz] |
| A9 | L/R | 3.5 | 5 | |
| A10 | L/R | 4.5 | 6.3 | |
| A11 | L/R | 5.6 | 8 | |
| A12 | L/R | 7.1 | 10 | |
| Side B: Tracking Ability Test Record as per DIN 45549: A test record based on this standard was produced by DGG. | ||||
| B1 | Left Channel | 5.6 | 8 | Reference Tone Level = 0dB 1kHz 15seconds |
| B2 | Right Channel | 5.6 | 8 | Reference Tone Level = 0dB 1kHz 15seconds |
| B3 | L/R |
Rectangular wave 1kHz cut as triangle shape in groove with amplitude 11μm. L&R each 15seconds |
||
| B4 | L/R | 7.1 | 10 | Difference Tone
Test by 1.8kHz+2.2kHz (1:1)
L/R interchanging every 12 seconds |
| B5 | L/R | 8.8 | 12.5 | |
| B6 | L/R | 11 | 16 | |
| B7 | L/R | 14 | 20 | |
| B8 | L/R | 18 | 25 | |
| B9 | Lateral | 7.0 | 9.9 | 315Hz peak amplitude 50microns (displacement 0 to peak) |
| B10 | 8.4 | 11.9 | 315Hz peak amplitude 60microns (displacement 0 to peak) | |
| B11 | 9.8 | 13.9 | 315Hz peak amplitude 70microns (displacement 0 to peak) | |
| B12 | 11.2 | 15.8 | 315Hz peak amplitude 80microns (displacement 0 to peak) | |
| B13 | 12.6 | 17.8 | 315Hz peak amplitude 90microns (displacement 0 to peak) | |
| B14 | 14.0 | 19.8 | 315Hz peak amplitude 100microns (displacement 0 to peak) | |
| B15 | 15.4 | 21.8 | 315Hz peak amplitude 110microns (displacement 0 to peak) | |
| B16 | 16.8 | 23.8 | 315Hz peak amplitude 120microns (displacement 0 to peak) | |
DIN 45550 (1976):Schallplatten-Hüllen; Außen- und Innenhüllen, Maße und Beschriftung (Record sleeves; outer-and inner-sleeves, dimensions and inscription) & DIN 45551 (1976): Schallplatten-Kassetten für 30 cm-Schallplatten; Maße und Beschriftung (presentation-box for 30cm-record; dimensions and inscription)
The German people really likes norms - I never imagined such specifications were existing. Jacket size for LP is width315xheight311 with side opening (inner thickness 2mm). Basic inner sleeve for LP is almost square(w309xh304) with circular cut for label. DIN 45536(Mono 17cm)/45546(Stereo 17cm) &45537(Mono 25/30cm)/45547(Stereo 25/30cm) are quoted as specifications of records though sleeve for 25cm records is not specified (maybe by 1976 the production of MP=medium play records is much reduced). See also my Japanese page about jacket, inner sleeve & box.
My Summary Note:
These industry standards (IEC/DIN/NAB/JIS) cover almost all the products specifying minimum requirements for not only soft but mainly reproducing equipment available at the times. Hence their specifications don't tell anything new/essential on music recorded groove radii. One thing I feel curious in IEC60098(1987) is about inner groove radius 63.5mm which is related to the performance of automatic player (my Kenwood P-5E Linear Tracking Player will lift arm around 60mm radius before finishing groove located around 54mm radius). In 1987 when CD players became already popular, it might be thought that record players could be also automated as seen mostly in low and middle price range of record players.
It seems funny to me that some long time play-back records have not utilized inner radii to maximum. For example, one EMI/Seraphim record: Schubert String Quartet No. 14(Death and Maiden)=38min26sec on one side (pseudo-stereo made from monaural recording) and Piano Quintet (Trout)=32 minutes on other side (both inmost recorded radii are larger than 70mm). Usually it is said that LPs have 150-300 grooves per inch. Hence when music band width is max 83mm(146.5-63.5) then 490-980 grooves for 15-29minutes. The above EMI/Seraphim case: 38min26sec/75mm=about 433 grooves/inch - too fine pitch! I suppose that this record has not utilized extreme inner groove radius in order to avoid (expected) inner tracing distortion by the sacrifice of out-put level (dynamic range and S/N).
Lateral
Tracking Error and its distortion: it might be critical (audible) only with
recent elliptical/line contact tip in stereo groove esp. if anti-skating
mechanism is not equipped on overhang-offset arm. With spherical tip in monaural
groove, its distortion is not so critical even without anti-skating mechanism
(or other distortions due to spherical tip are enough to mask this relatively
small distortion?). Considering the inner groove is rarely less than 70mm for LP
and if the inmost music groove radius is 63.5mm and outmost music groove radius
is 146.3mm, an optimum arm design based on Baerwald method can be as follows:
Linear Offset for Baerwald method i.e. peak distortion rating similar at
63.5/88.561/146.3mm is 96.04mm (instead of current Baerwald type linear offset
around 93.5mm)
Null points: 69.2/122.8mm (instead of current Baerwald type null points:
66/120.9mm)
In comparison with current Baerwald type, this new design has wider offset angle
and also increased overhang (hence higher anti-skating force required to mate
with increased side thrust force).
Anti-skating mechanism is problematic. It is rare that the anti-skating force
will match side thrust force due to eventual friction forces. Some Thorens arms
have 4 different scales for anti-skating: wet/dry x spherical/elliptical
tip. The following graph shows imbalance of pressures on flank L/R for
three representative designs of geometry (Stevenson/Baerwald/Loefgren) when
anti-skating device is omitted (parameters: effective coefficient of
stylus drag 0.3 and effective length of arm 231.2mm).
Note: theoretically the true coefficient of friction = 1/(SQRT(2) ) of the
measured or empirical value since vertical stylus pressure is to be divided statically
into VTF/(SQRT(2) ) each on groove flank. Then stylus drag force is
[VTF/SQRT(2)]*2*coefficient of friction=VTF*SQRT(2)*coefficient of friction. This tricky calculation is based on armchair theories
because the VTF cannot be actually divided evenly during stylus drag.
Hence usually effective coefficient of stylus drag as empirical results
is assumed to be theoretically equivalent to SQRT(2)*coefficient of
friction. This coefficient of stylus drag 0.3 (coefficient of friction 0.212)
for example is rather too small in comparison to the past investigations
(coefficient of stylus drag 0.27-0.5 by Rangabe or 0.25-0.55
by JVC-1979 as shown in the following table). The dynamic
load of stylus pressure on the groove is never constant. Many factors are involved in the nature of stylus
friction: stylus contact profile
and record elasticity (depth of stylus dipping into groove wall by VTF - see my stylus.xls), groove
modulation amplitude and frequency, mechanical impedance of stylus movement
corresponding to such groove characteristics, and mostly dust and sticky
substance
on contaminated records and stylus tip.
There are
some drawbacks in the
actual performances of anti-skating devices:
1) The lateral balance is affected
by adding bias force.
2) "Swinger" action of arm by the eccentric groove
or off-centre record increases the stylus side-pressure more by adding this device.
3)
Non-mechanical contact such as magnetic or electromagnetic anti-skating device
may be ideal.
Users after 1970s are satisfied simply by
finding that such fashionable device or accessory is equipped on arm. IMO:
Basically it is better not to use this device. Increase VTF around 10% if
necessary. In my experience it is better than adjusting bias force of
anti-skating device. To use such device or not to use is up to
you.
|
The following rates seem to be indicating stylus
drag coefficient instead of coefficient
of kinetic friction: |
|||
|
Groove modulation |
Spherical tip (17μ) | Elliptical tip (7x17μ) | Shibata tip (7x65μ) |
| Mute plain groove | 0.25 | 0.3 | 0.28 |
| 3~10cm/s | 0.3 | 0.4 | 0.35 |
| 8~16cm/s | 0.45 | 0.55 | 0.5 |
| 30kHz 5cm/s | 0.4 | 0.5 | 0.45 |
Note that
the deflection of cantilever due to the side thrust force (skating force) is too
small that one cannot adjust anti-skating force seeing the deflection of
cantilever (see the following drawing and think coolly on the normal human
eyesight). When we recognise apparently cantilever deflection during playing a
record, then it has a defective cantilever or anti-skating force is too high.
Hence both Dual Skate-0-meter and Orsonic
Lateral Pressure Detector were invented as magnifying
device to see cantilever deflection. Lehmann and Harnisch invented Dual "Skate-0-meter" and
commented in their US Patent 3328037-1967: "To
permit accurate adjustment, hitherto a record was used which had no grooves but
only a smooth surface. The pick-up with its scanning needle was placed on the
rotating disc and the antiskating so adjusted that the pickup remained
stationary. Investigations have proved that this method is only apparently
accurate. The actual friction of the scanning needle in a sound groove is
different. Direct measurement of this friction, which as such gives a direct
measure for the necessary anti-skating force, is however relatively complex."
And they recommended to apply Skate-0-meter on a plain groove with normal
recording pitch while Nakatuka in his USP4183537-1980 recommended to apply
Orsonic Lateral Pressure Detector on sound grooves for anti-skating adjustment.
Also note that usually the bottom profile of stylus is unspecified or unpolished
since such part of stylus is designed simply to have enough clearance from the
bottom of groove. The higher stylus drag for higher frequency and higher
amplitude can be attributed to the mechanical impedance of respective pick-up.
In order to move stylus in higher frequency, there arises instantaneous higher
stylus pressure to groove walls as reaction from undulating walls. Thus
effective low mass or low inertia of moving parts is required for tracing such
high frequency recorded groove with relatively light stylus down-force.
Mechanically a pickup has three different (stiffness or
compliance/resistance/mass or inertia) controlled domains in mechanical
impedance curve. Typically: stiffness controlled domain (20Hz-1kHz* see note),
resistance-domain (1kHz-10kHz or around) and mass- or inertia-domain (around
10kHz and upward) though its domain and curve of mechanical impedance (dyne
sec/cm) is shifting up or down as per the make and design.
*Note: "Compliance at 100Hz"
in the specification for some Japanese cartridges must be considered in this
lower frequency range. It is often misunderstood as if it would be intended for some
calculations at arm-cartridge resonance around 5Hz-20Hz. In fact it indicates
an index convertible to a mechanical impedance at lower frequencies for the
purpose of obtaining the vertical stylus pressure required for safe tracking. It
is concerned with tracking ability and not with resonance. Hence it is of no use for
amateurs who try resonance calculation. Frankly speaking the required VTF value
instead of compliance value is enough for users. Since 1970s Shure has not
indicated "misleading" compliance value, but instead indicating VTF value sometimes
together with trackability chart (max. traceable velocity [cm/s] per
frequency under specific VTF). The mechanical impedance [dyne sec/cm]
chart for full frequency range (technically equivalent to Shure trackability
chart) is more important than compliance at lower frequencies. Please see the
relation among mechanical impedance, compliance and recorded velocity as
explained in technical sheet
attached to DENON
test record XG-7001. By measuring the mechanical impedance, it is possible
to know the stylus pressure required for tracing on specific velocity of
record. Think on the relation
between Shure trackability chart and Denon mechanical impedance chart i.e.,
between velocity and VTF. Naturally it is concerned with the recordable and
recorded velocity on actual records.
According to the AES report in 1968 by Toshiba engineers: "Trackability
Test by Complex Tones and Biasing Force Effects of Phonograph Pickups": "Some
of the so-called "high compliance" cartridges have produced larger
I.M.D. under the specified tracking force than those of relatively low
compliance. For low modulation level both cartridges have similar
characteristics, but for high modulation level the former are much effected by
side thrusts. Side thrust less than 0.05g is allowed for I.M.D. less than 10%
for high compliance cartridges.
From this, "high compliance" cartridges operating under small tracking
force are not necessary good from the viewpoint of degradation by biasing forces".
My note: I cannot believe 0.05g can be threshold for IMD less than 10% since
all cartridges mounted on swing arms have received temporary side thrust more
than 0.05g. Usual side thrust and antiskating bias at stylus point are
considered average 10% of VTF. We must consider the nature of side forces
(temporary or steady) and wherefrom (groove modulation amplitude and velocity or
arm geometry etc). Naturally force from groove modulation (displacement) is generally
larger than side thrust from arm geometry. BTW: In 1969 other engineers of
Toshiba invented Photo-electric pick-up(GB1281912
& DE1941407)which could measure VTF as well as effect from side
thrust. It is embodied as pickup C-100P and preamplifier SZ-1 enabling proper
VTF adjustment although the biasing mechanism is omitted from embodiment.
In
JVC book(1979), Shibata as one of the writers commented as follows: "Cantilever
deflection can reach more than a few degrees
by side thrusts so that
tracking angle error distortion is increased. To avoid such occurrence, the
compliance should be kept not excessively high, and linear tracking arm (not
swinging but linear shifting) is preferable". IMO: Deflection of
"a few degrees" is contradicting to above drawing, but under certain
stress loading for long time, cantilever may be deflected and not reverted to
the normal position (permanently deformed damper). In my experience, high
compliance cartridge with soft damper tends to bent its cantilever angle after
long use: outward bent under 0 anti-skating force, inward bent under excessive
anti-skating force. It is not easy to know the
actual operating angles in both antiskating bias and tracking angle adjustments
though some audiophiles are fond of such adjustments based on some devices. I
find some cartridges having the cantilevers not located in the centre from the
first. Personally I don't believe the efficiency of antiskating devices
(gimmick/diagrammatic arm-chair theory/gadget) which ignore the resistance at arm
pivots, effective mass of arm and compliance of cartridge.
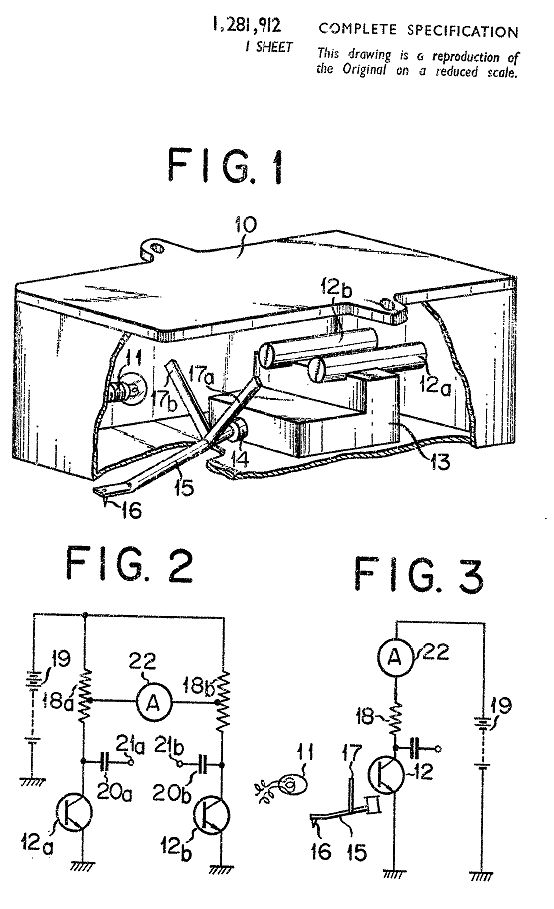
Fine Groove Dimensions
| The appropriate spherical tip radius depends on the dimensions of groove modulation | ||||
| IEC98(1958) | IEC98(1964) | IEC98(1987) | ||
| 1 | groove bottom radius | <7.5micron | <4micron | <8micron |
| 2 | bottom clearance | nil | nil | >2micron |
| 3 | top width* | >55micron* | >51micron* | >30micron |
| 4 | included angle of spherical tip | 40-50degrees | 40-55degrees | <55degrees |
| top width* is applicable for monophonic only. In DIN 45547 Stereophonic disk records St33(1981) top width average 35micron, momentary value 25micron | ||||
Spherical Tip on Fine Groove: Strictly speaking not spherical because it has included angle less than 55degrees in order to reduce pinch effect to some extent (about 40% less as compared to true spherical ball tip).
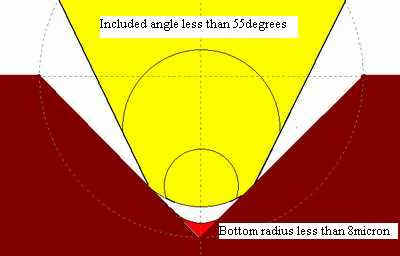
There are various methods for finishing spherical tips from conic shapes. In short: If the included angle of cone is less than 55 degrees from the first, then only the bottom point of tip is rounded to specific radius simply. In case of making elliptic tip from cone, the included angle of cone more than 55 degrees and "not more than 60 degrees" as per USP 3292936-1966 by Grado is also used. JIS S8516-1976 (Stylus) described as follows: "sapphire or block diamond type stylus should have the included angle 40-55 degrees while bonded diamond type can have the included angle up to 60degrees avoiding dropping the tip due to the small area for bonding a tip on the metal base."
|
Applied maximum spherical tip radius is half of minimum top width of groove |
| tip radius 76micron (3mil) : minimum top width about 152micron for monophonic coarse groove (SP) |
| tip radius 25micron (1mil) : minimum top width about 50micron for monophonic fine groove (LP) |
| tip radius 18micron (0.7mil): minimum top width about 35micron for mono&stereo fine groove (LP) |
| tip radius 15micron (0.6mil): minimum top width about 30micron for mono&stereo fine groove (LP) |
| tip radius 13micron (0.5mil): minimum top width about 25micron for stereophonic fine groove (LP) |
| This table will not indicate actual tip radius nor groove top width. My intention is to show the relation between applied stylus radius and groove modulations i.e., in order to land spherical tip on 60~70% height of the groove walls for respective minimum top width (hence I underlined maximum and minimum). About various top width, please look into Standards Table and JIS S8502-1973. |
Sample of stereophonic groove: Note that top width of stereophonic groove is changing momentarily and that the minimum top width is depending on the displacement (amplitude) and the nominal top width of plain groove - see my excel file for simulation which is made originally for my understanding 90 degrees recordings (stereophonic 0/90=L/V mode or 45/45 mode - currently only 45/45 mode is adopted for stereophonic recording and reproduction). Specific to stereophonic groove of 45/45 degree modulations, the amount of lateral displacement is always same as that of vertical displacement irrespective of amplitude and frequency differences between channels. Hence cartridge to trace such groove should have same compliance laterally as well as vertically - however lateral compliance is usually higher than vertical compliance in most stereophonic cartridges. In practice the stereo grooves are cut with various kinds of limiters. In US Patent 3013125 (Stereophonic Recording) Goldmark referred to such limiter: "Normally, these two signals [sum and difference] are of similar amplitude and it is difficult to design a pickup which will follow them without generating distortion. We have discovered that the difference signal can be limited in amplitude so that it will be as little as one-half that of sum signal, or less, without impairing substantially the stereophonic character of the recorded information." Sum component (lateral displacement) is in phase portion & Difference component (vertical displacement) is out of phase portion between each signal in stereophonic two different sounds in 45/45 mode. In case of playing (stereo-)compatible discrete 4 channel records, same compliance for both lateral and vertical directions was demanded for pick-up cartridge. In case of playing usual stereophonic grooves cut with such vertical amplitude limiter (i.e. depth control), the imbalance of cartridge compliance for lateral/vertical directions did not become any serious problem since stereophonic groove in practice was a gimmick or the product of compromises from the outset!
Polarity of modulations was defined by JIS C5503(1979) about
pickup for discrete 4 channel records and IEC 98(1987) about general
stereophonic equipment. However these standards have not been strictly followed in practice.
The matter of absolute polarity remains unsettled actually. It is not so simple as amateurs imagine
on their armchairs. The polarity of
monophonic pickup was not defined by any standard and there is no scientific
proof about the harmful/audible effect of reverse polarity as far as phase
between channels in stereophonic equipment is in phase for monophonic source.
The effect of reversing polarity alternatively may be audible with the
equipment esp. speaker systems which have not linearity of push-pull motion (then
it is not the matter of polarity, but matter of linearity). Takahashi explained in his USP3803367(1974) assigned to JVC: "An
established standardization specifies that in cutting and recording, the groove
walls shall move upward(downward) when the left(right) channel signal is of
positive polarity". He applied for Japanese patent in 1971
when standardization of 4 channel records (regular matrix, SQ matrix and
discrete CD-4) was discussed in EIAJ and RIAJ. But people in general rejected
complicated systems so that the heat for 4 channels was cooled down soon after 1975. After the
failure of 4 channels, engineers sought new development for digital recording on
tape. PCM analog records were produced accordingly until the appearance of CD.
[Peculiarity in stereo-compatible discrete CD-4 system: It demands very strict
definition of polarity because reverse polarity results in exchanging front and
rear channels after passing demodulator - it is inconvenient]
JIS C5503(1979) 5.1(1) Polarity: "When the stylus is displaced
laterally, it is in the same phase between channels. And when the stylus is
moved outer from the centre of record, + voltage should be generated in
cartridge terminals with marking (hot/+)" explaining further "polarity
definition is necessary for the pickups used in reproducing discrete 4 channel
stereo records. It is desirable that stereophonic pickups for general use follow
this standard." Similarly IEC98 3rd edition(1987) and its German
translation DIN-IEC98(1989) had clause 8.2.4 Polarity of Channels. The
following drawings are made in accordance with JIS C5503(1979) and IEC98(1987). Note
that outputs shown in the drawing are for true monophonic pickups
with sensibility to the lateral movement of stylus while the efficiency of
monophonic output for stereophonic pickups should be reduced to 1/SQRT(2)=+/-70.7%
each channel. HISTORICAL VIEW: In monaural age, cartridge with two pins was not showing
polarity (in case of turnover system using common generating element, the
polarity was exchanged by turnover action). In stereo age, phasing between
channels was
required so that +/- was indicated as stopgap. In CD4 era absolute polarity was
required for reproduction through demodulator (even then the absolute polarity
on recording was not questioned). Technical members such as IEC people
would not meddle with recording practice, while recording people would not care
much about standards.
Test Record TRS-1004 by JVC from CD-4 era contains Band 12: absolute polarity check by rectangular wave 370Hz duty ratio 3:7 (one cycle 2.7ms) explaining "the shorter pulse (0.81ms) shall be on plus side while longer pulse (1.89ms) shall be on minus side."
One channel of coil for driving stereophonic cutter is connected reversely. At the time of reproducing records with 45/45 type stereophonic cartridge, one channel output coil is reversely connected inside resulting in inphase for lateral movement, out of phase for vertical movement. In very rare case, one channel coil could be reversely wound or magnetic circuit of one channel could be reversed in order to obtain same result.
There are various distortions peculiar to Stereo LP records
How stand the relative rates among these distortions? If you are interested in the equations for the following simulations, please download my EXCEL file and check by yourself.
I would not like to perplex audiophiles, but true to my mind I try to
explain. THERE IS A LONG LONG HISTORY IN RECORDING: At first Vertical monophonic
Phonograph cylinder (1877) Next Lateral monophonic
Gramophone record (1895) Monophonic (micro or fine groove) LP record (1948) & 45 rpm record (circa
1949) and Stereophonic record in 45/45 mode (1958). Experiments of V/L two channels recording were finally abandoned by the
end of 1957 though V/L mode was once thought easy to be realised as additional
V or L modulation to another.
Frederick Vinton Hunt (1905-1972) wrote
together with his colleague J.A. Pierce: "On Distortion in Sound Reproduction
from Phonograph Records" J.A.S.A 1938 monumental papers simulating various
phonograph distortions. W. D. Lewis and F. V. Hunt: "A Theory of Tracing
Distortion from Phonograph Records" J.A.S.A. 1941. These researches led to
the development of criteria that eventually made possible the long-playing records
with lateral undulations. And further if V/L (V/H) stereophonic mode is adopted, there arises a quality
difference between two channels because vertical tracing distortion is higher
(almost double) than lateral tracing distortion.
Keller and Rafuse mentioned in USP2114471-1938: "In the systems of this
general type proposed heretofore the two recordings have usually been made as
vertical and lateral undulations respectively. With a system of this type,
however, it is very difficult to obtain identical quality of reproduction from
the two recordings." Therefore finally 45/45 stereophonic (recording & reproducing)
system was adopted since 1958.
Due to different styli shapes between cutter and reproducer etc
A. Vertical Tracing Distortion (mainly 2nd harmonic at 1kHz, 3rd harmonic increases at 10kHz). The following graph indicates the trajectory of spherical 18micron tip centre on sinusoidal vertical modulation at velocity 6.3cm/s, groove radius 6cm, frequency 5kHz.
B. Horizontal Tracing Distortion (mainly 3rd harmonic distortion) due to different styli shapes between cutter and reproducer.
These (A&B) can be improved by making tip radius smaller. IEC98(1987)
specified groove dimensions: top width 30micron min. bottom radius 8micron max.
The clearance between the stylus tip and bottom of the groove shall be 0.002mm
min and the stylus tip shall not touch the groove edges. In order to get such
clearance from groove bottom and edges, the appropriate radius of spherical tip
shall be limited to 0.5-0.8mil (13-21micron).
The effective (contact with groove flank) radius of curvature of elliptical tip
is 0.2-0.4mil while its radius toward bottom is more than 0.7mil
(18micron). But too small tip may dig dust in the bottom of
groove so that it tends to be noisy.
There is a distortion toward inner groove namely "pinch effect" which can be reduced by using elliptical tip. This effect may cause vertical modulation of double cycle. In case of fundamental 5kHz lateral recording, the cycle of vertical modulation due to pinch effect is 10kHz. If cartridge has same compliance for vertical and horizontal movement, then the distortion due to pinch effect shall be approximated as shown in following graphs."before RIAA" means before RIAA equalization, "after RIAA" means after RIAA equalization. Here the distortion ratio % is calculated as Vertical velocity (arising from pinch effect) divided by Lateral velocity of the recorded signal. Though this pinch effect is not counted as tracing distortion usually, its nature (2nd HD) looks like a variant of vertical tracing distortion (2nd HD) in spite of original lateral groove modulation. Pinch effect to a considerable extent can occur also in stereophonic groove modulations which contain larger part of lateral (sum) component as Goldmark suggested.
Schematic of 1.3kHz Lateral Modulation at groove radius 6cm, displacement peak to peak 30µm:velocity about 12.25cm/s (velocity=2pfa where f=frequency, a=displacement of 0 to peak)
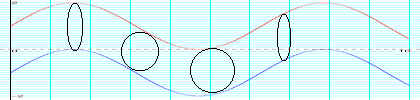
At tracing the above groove with spherical tip radius 18micron, the inclination of modulation corresponds with that of points of contact of spherical tip on flanks. Pinch effect eminent toward inmost groove radius is additional vertical modulation arising from original lateral modulation of high velocity/frequency. In this case, vertical output calculated (1micron x 2f)/(15micron x 1f) is 13.5%(-17dB) of lateral output.
There is an additional distortion (similar to Wow=fluctuating groove speed±%) due to eccentric groove or hole which happens to be displaced more than 1mm sometimes. Right graph shows Fluctuation of Frequency at groove radius 10cm with eccentricity 1mm where pitch (groove speed) fluctuates +/- 1% per rotation=1.8sec in case of 100/3rpm (200degree/sec) from recorded frequency. Thus the rate 0.5555cycle(=once per 1.8sec) indicates modulating frequency (FM). Additional amplitude modulation (AM) if any due to this displacement is rather small (max 0.35cm/s at 1mm displacement of hole) and harmless since this amplitude of 0.5555Hz can be usually suppressed with filter and compliance of cartridge as far as arm pivot has high sensitivity to follow this displacement smoothly. Meanwhile frequency fluctuation (FM) shall remain uncompensated with any filter.
There is
still another kind of distortion: Reproducing loss of fundamental at higher
frequency depending on tip radius & groove radius & amplitude of
recorded level. The frequency response of high frequency is usually measured at outer groove radius
and the recorded level (amplitude) for frequency response test is lower than
reference tone level (see DIN 45543 test record etc). Lateral modulation at
outer groove radius 11.5cm shall mean groove velocity around 40cm/s where this
loss is almost negligible. Graphs show loss at lateral modulation: constant
velocity 5cm/s peak (flat recording without RIAA recording emphasis).
Vertical reproducing loss is almost twice lateral reproducing loss.
Percy
Wilson commented in his book "THE GRAMOPHONE HANDBOOK" (P.42-43: year
1957) about the reducing line speed toward inner radius of record: "This
causes a progressive attenuation of treble notes in reproduction from the outside to the inside of a
record. To compensate for this some recording companies use a progressively
increasing treble pre-emphasis as the stylus moves across the record. This is
known as "radius correction"." In
my estimation many recording companies since SP era had applied radius
correction plus standard recording curve (RIAA/IEC/BS etc) during recording
process in order to make good sound balance across the records. When old
records have been recorded in such way (pre-compensated suitably for
reproduction by standard spherical tip), then advanced line contact stylus with
much reduced tracing loss would reproduce unbalance (emphasis on high frequency
band) at inner groove radii of records. It is quite questionable
whether modern records have been recorded or designed suitably for any special
styli or not. As of today there is no well-established standard except for spherical styli.
BTW: Radius correction has both desired and
undesired effects on sound: frequency response across the record may be
improving while the tracing distortion is increasing by additional emphasis on
treble. This dilemma could be solved by tracing compensator (pre-deformed signal
recording) in early 1970s? It remains unclear since many recording companies
stopped mentioning specific solution after late 1970s. In vinyl record one
solution of a problem is apt to produce another kind of problem like a whack-a-mole game.
I find most significant passage in NAB(1964) as follows: "In
disc recording, it is the generally accepted practice to evaluate sound quality
and musical balance of a disc on a reproducer which has a specified response
- frequency characteristic". This point is often ignored by
many audiophiles who discuss sound quality with their favourite equipment used.
I feel enough with their reviews. Phew!
Due to different angles between VMA (effective vertical modulation angle) at recording and VTA (vertical tracking angle) at reproduction
C. Vertical Tracking Distortion: The height adjustment of arm cannot affect this distortion on a large scale since the rate of height change at arm post is very limited: max±1.3degree by ±5mm at the effective lateral length of arm 220mm while nominal VTA of current cartridge is ranging from 15 to 25 degrees and there is no way to ascertain actual VMA of each record. It is truly complicated about distortion arising from the difference between VMA and VTA. Note that 2nd harmonic distortion % as shown in graph is based on one sinusoidal wave only while there must be another distortion from mixed tones as used in measuring VTA of cartridge by DIN 45542 test record (f1=1850 or 370Hz f2=3150 or 630Hz) etc. IMO: QUALITY CONTROL of cartridge about VTA&SRA is most important since sound quality cannot be improved afterward by changing VTA of existing cartridges forcibly to comply with VMA: to change VTA drastically is to change SRA at the same time - deviating further from allowable range of SRA between +4 and -8degrees for non-spherical tip.
Due to the error of Lateral Angle/Alignment
D. Lateral Tracking Distortion: The distortion rate at larger error angle is similar to that at VTA difference (see above graph). This 2nd harmonic distortion can be reduced to less than 1% with correct alignment for pivoted arms. When the deviation from exact alignment is within +/-3mm for overhang (shift on shell) or shift of arm on bedplate, then error angle is within +/-4degree and distortion less than 2% with 9inches arms at signal velocity 5cm/sec. Theoretically 0% for linear tracking arms (nominal error max 0.15degree for most linear trackers using LED+photo sensor+motor to control angle error). The following graph shows comparison of Micro MA-505 (Effective Length 237mm near to "Stevenson type" alignment) and "Baerwald and Loefgren type" alignments applied for the arms of same length when aligned each as designed. Note on this graph: in order to make prompt and easy comparison with other graphs of distortion & ratings, signal velocity is set at 5cm/sec instead of usual 10cm/sec.
BTW: There is no effective measuring method for distortion due to lateral tracking angle error because this kind of distortion is usually masked by much bigger distortions (i.e. tracing distortions) when tracing actual record with a stylus tip of considerable contact radii. Also read as follows about the comparison of various distortions. Generally tracking (angle) error distortion is in small order (less than 2%) in comparison with tracing error distortion (often exceeding 10%) due to effective contact radius of stylus tip. Hence in order to check angle error and alignment it is of no use to see playback wave forms on oscilloscope since distortion rate ascertainable on oscilloscope should be more than 10% otherwise not easy to find as a distortion or deformed wave. Actual impulsive mis-track (stylus skipping from groove walls mainly due to defective groove or dirty sticky stylus) can be seen on oscilloscope or heard very cruelly with our ears.
Theoretical rate of distortions:
For example: tracing 5kHz velocity of 5cm/sec peak with spherical tip
radius 18micron=0.7mil.
Velocity 5cm in the following analysis should be understood as vertical
modulation velocity for A & C and horizontal/lateral modulation
velocity for B
& D. But all distortions from A to D will be involved in actual
stereophonic groove which has lateral and vertical components. In stereophonic
pickup the velocity toward 45 degrees should be counted - hence vertical or
lateral modulation velocity 5cm/s can be converted to 3.54cm/s [=5/SQRT(2)] per channel
for direction towards 45degrees. Inversely modulation velocity toward 45degrees
can be divided into x1/SQRT(2) each for lateral and vertical components. Hence
upon measuring distortion actually on test record, we must be careful about the
kind of groove (vertical/horizontal/45) and its velocity specified in cm/s peak or
rms.
At inner groove radius 6cm
A. Vertical tracing distortion/VTD:2nd harmonic distortion rating 32%, 3rd
harmonic distortion 16%
B. Horizontal=Lateral tracing distortion/LTD: Mainly 3rd harmonic distortion
8%
C. Vertical tracking distortion/VtD: 2nd HD 2.1% with Cartridge VTA 5degree
different from VMA, 4.2% in case of 10degree difference
D. Lateral tracking distortion/LtD: Baerwald type alignment usually under 0.3%
for groove radii 60-146mm. If you use Stevenson type alignment null point around
60.325mm, then distortion is ignorable toward inmost groove.
At outer groove radius 14cm
A. VTD: 2nd harmonic distortion rating 6%, 3rd harmonic distortion 0.5%
B. LTD: Mainly 3rd harmonic distortion 0.3%
C. VtD: 2nd HD 0.9% with Cartridge VTA 5degree difference, 1.8% with VTA
10degree difference
D. LtD: Baerwald type alignment 0.3% for groove radii 60-146mm. If you use
Stevenson alignment, then distortion reaches around 0.4% at this radius and
around radius 8cm.
In short, vertical tracing distortion is bigger than lateral/horizontal tracing distortion because vertical movement is restricted with contact height only while the needle for horizontal direction is restricted by both sides of walls. And this might be the good reason why monophonic sound with lateral modulation is better than stereophonic sound with 45/45 modulation. I find the following text in US Patent 3229048 for RCA Dynagroove: "An analysis of tracing distortion shows that lateral cut records are superior to vertical cut records (hill-and-dale). In lateral cut records, the two groove walls, moving in the opposite directions relative to the reproducing stylus center, form a push-pull system which tends to eliminate the even order harmonic and intermodulation components of tracing distortion. In vertical cut records, vertical-lateral stereophonic records, or in 45-45 type stereophonic records the cancellation of even order harmonic and intermodulation distortion does not take place and the tracing distortion problem becomes significant."
Note on graphs: above input frequencies (f) are fundamental. Hence actual distortion for velocity sensitive cartridge output after phono stage (RIAA equalization) : 2nd harmonic distortion shall be reduced to almost 1/2, 3rd to 1/3 over 5000Hz. These adjustments can be applied for all harmonic distortions though it is complicated further due to pre-emphasis (recording characteristics of RIAA with emphasis around +6dB/Oct at high frequencies). I read that the peak of high frequencies spectra in classical music has level roughly -6dB/Oct as seen in the next graph (a broken line indicates a normalization). In fact the technical background of analog disc recording is based on such data of music proper. Recording curve for LP and suitable recording instruments with due recordable limits have been developed for such music. IMO: Hence it results in presumably flat/limited recorded velocity over 1kHz by counterbalancing recording emphasis +6dB/Oct with natural decrease around -6dB/Oct toward the highest end - it was lucky technically too (overload of higher frequencies at recording can be avoided). But "new music" or "noises" might have another kind of spectra. Mr. Yamamoto in his book 1971 commented as follows: "The RIAA recording curve was decided originally for monaural LP, hence new recording curve suitable for 4-channel and stereophonic records shall be taken into consideration. Recently new music with much different spectra is emerging so that now it is high time to reconsider RIAA recording characteristics." RIAA curve was standard de facto and not standard de jure. Anyway RIAA standard is good as long as new vinyl disc is not developed anymore and we can enjoy the legacy of LP records in their heyday (mid 1970s on worldwide production scale).

A conclusion: highest distortion for high frequencies arises from VTD at inner groove in particular. Meantime it is said that the vinyl deformation due to its elasticity reduces such extreme distortions and the real rates of distortions are less than calculated: Distortion from the elastic deformation of groove wall is rather small in comparison with tracing distortion and it has reverse phase of tracing distortion so that the distortion in effect becomes smaller than the theoretical value of tracing distortion [Shiga: Distortions in Stereo Disc Record 1961]. According to my EXCEL file based on simple geometric simulations, the relative distortion in inner groove radius is rating roughly as Lateral tracking angle error distortion or Vertical tracking angle error distortion (2nd HD)< Lateral Tracing distortion (3rd HD) < Pinch effect (2nd HD) < Vertical Tracing distortion (2nd HD).
Main problems when simulating the distortions for vinyl reproduction: Above analysis on respective distortions is based on a ball model tracing on sinusoidal groove modulation. And this simulation or calculation is carried out usually on 2 dimensional planes separately. That is: vertical modulation (vertical tracing error from original trajectory of groove modulation)/lateral modulation (lateral tracing error from original trajectory)/pinch effect (additional vertical modulation arising from original lateral modulation)/VTA difference (difference between the vertical movement of cantilever and effective modulated angle of record)/Lateral tracking error because of arc movement of the pivoted arms. Then how is all in all of these distortions? If anyone is skilled in 3D CAD and applied mathematics, please try to make a model of modulated groove/stylus tip/generating system for more realistic simulation. As for me I am not capable of it - I must confess. Every distortion or deviation has different character having vertical or lateral or 45degrees or non-directional component so that the sum of these distortions in the result is in complex stage (impossible to sum up on one single plane actually).
Any
theory or analysis is valid within limited conditions. When playing our records
actually, many funny things happen so I would say "every play of an
analog record is a live performance" - maybe this is the reason why I
cannot leave analog records. The impression/experience is different (new - never
boring) each time. I am negative about the conversion to digital format from
analogue records since upto now I have not heard any good
(professional/unprofessional) conversion to digital format (losing such vivid
performance obtainable from every play of records). I think this is not the
matter of selecting suitable equalization nor kinds of pickups nor reasonable
arrangement of the equipment. These are my findings as of today. Funny or
strange enough though. Some kinds of distortions might attract vinyl addicts
since distortions can be parts of music. I find analogy between foods (nutriment
and other ingedients with taste) and music (pure tones together with digestible distortions). Mr. Nakajima Heitaro (one of
inventers/promoters of CD) later invented USP6344940-2002: "Method and
apparatus for adding 1/f fluctuation to an audio signal" commenting
that "The present invention provides a digital signal reproduction
apparatus and a digital reproduction method which employs fluctuation in a
sampling or quantization process, so as to eliminate lack of depth feeling in
digital data, increasing the pleasantness." Though his approach seems
to be almost disregarded by others, I appreciate his courage to seek
psychological aspects of music at hearing. It is said that natural sounds contain
1/f fluctuation producing atmosphere full of anima and depth feeling. Good sound
or reproduction is a kind of illusion. What is goodness in illusion is
impression or great concept one can receive. PS:
In 2018 Sony developed "Vinyl Processor" incorporated into new Walkman
simulating tonearm resonance, surface noise and sound-feedback of vinyl
reproduction. According to Takashi KANAI: 1. Wobbling sound of low resonance at
vinyl reproduction affords pre-motional effect to woofer so that the sounds take
rapid response. 2. By adding surface noise to music, the music can be more
audible in certain noisy circumstances. 3. By adding sound-feedback, music
sounds more intimate. I don't agree with him, but surely this is a new
horizon or point of view anyway - maybe they are applying for patents soon.
Now I feel that difference between analog recordings and digital formats is the
range of illusions: Range of illusions for digital formats is small while the
range of illusions for analog records is rather wide (incidental factors are involved in analog records and its hearing through
equipment one has).
Another important factor is the effect of temperature which cannot be ignored. The following figure is taken from JVC book (1979). JVC explains: "It is well-known that sound quality and tracing condition are affected by temperature. We find two main reasons: 1) the high stiffness of cartridge damper in case of popular cartridges 2) the record stiffness in case of high-class cartridge. Generally the damper of popular cartridges is rather stiff from the first and the temperature affects rubber compliance for tracking ability. In case of high-class cartridge the temperature affects the stiffness of records to change the high frequency resonance and mechanical impedance. This can be measured as follows: 1) measure frequency characteristic after cooling both record and cartridge. 2) cool record only 3) cool cartridge only 4) compare these characteristics with the frequency characteristics under the normal temperature. In case of the high-class cartridges with line-contact stylus for example Shibata tip: the relative stiffness of record is increased from 2 to 4 times in accordance with the wide area of line-contact tip so that the effect of temperature can be expelled out of the hearing range. By this, the variance of temperature can be almost ignorable with normal conditions. However anyway it is impossible to nullify the temperature characteristics of rubbers and plastics. Hence It is recommended to use record player in the environment temperature 20 +/- 10 degrees Celsius (around 69F)." My note about the relative stiffness of record. Usual record stiffness: Poisson ratio 0.35, Young modulus 3.3 10^9N/m2 average. Shibata in USP37749181-1973 explained the feature of Shibata stylus:"3) Since the area of contact surface contour between the stylus and the groove walls is relatively large, the result is equivalent to an increase in the stiffness of the record disc, and the resonance frequency of a vibrator becomes a high frequency. Accordingly, frequency characteristics capable of reproducing the recorded sound in an excellent manner are extended to a high frequency band. 4) As is known, the record disc softens when the temperature becomes high, and the above-mentioned resonance frequency fluctuates greatly with temperature. For this reason, in the case of conventional stylus, the resonance frequency is readily affected by the temperature since it is a relatively low frequency. In contrast, in the case of the stylus of this invention, resonance point which fluctuates with temperature is outside of the frequency band used and as a result, is not subject to the effect of temperature variations." The damper is mainly made of butyl rubber and its stiffness is controlled by the ratio of sulphur mixed into butyl. JVC (1979)commented on damper: "As of today, we could not obtain the equivalent equation representing the actual rubber damper of cartridge perfectly." Maybe the function of rubber damper is complicated so that simple mechanical simulation based on spring & dash-pot may be valid for a limited range or point only. Various constructions of dampers have been used for cartridges. Some are using double dampers or specially formed like cup. Some dampers are pre-stressed by tension wires to assign the damper to the designed compliance (tension is adjusted by a special device upon assembly) - in such construction, it is said that too tight tension causes over-damping suppressing high frequency while loose tension tends to cause a peak at high frequency. In the course of time, the frequency characteristic of cartridge is changed by time too. Sound tendency of cartridge life stages: dull at first use with recommended tracking force > definitive sound due to mature damper > lively sound due to deteriorated damper having loss of control > a bit metallic/noisy sound after considerable stylus wear.
From Japanese patent papers by Technics. These are popular-grade pickups with high frequency resonance lower than 20kHz as JVC pointed out (JVC graph is logarithm extending to 50kHz)? Interestingly left graph shows low frequency resonance together with high frequency resonance.
Compliance of cartridge as well as record is temperature-dependant so that it is in vain for amateurs to calculate low frequency resonance from once given compliance values. Low frequency resonance between cartridge compliance and arm mass can be measured actually by test record. Temperature is one of factors for making live performance from record.